Milwaukee Real Estate Trends

The Complete Guide to 2 Decades of
Milwaukee Real Estate Statistics
Discover the Numbers & Trends Behind Milwaukee County Real Estate in the Last 20 Years to Help Make Your Own Investment Choices & Real Estate Predictions for 2020
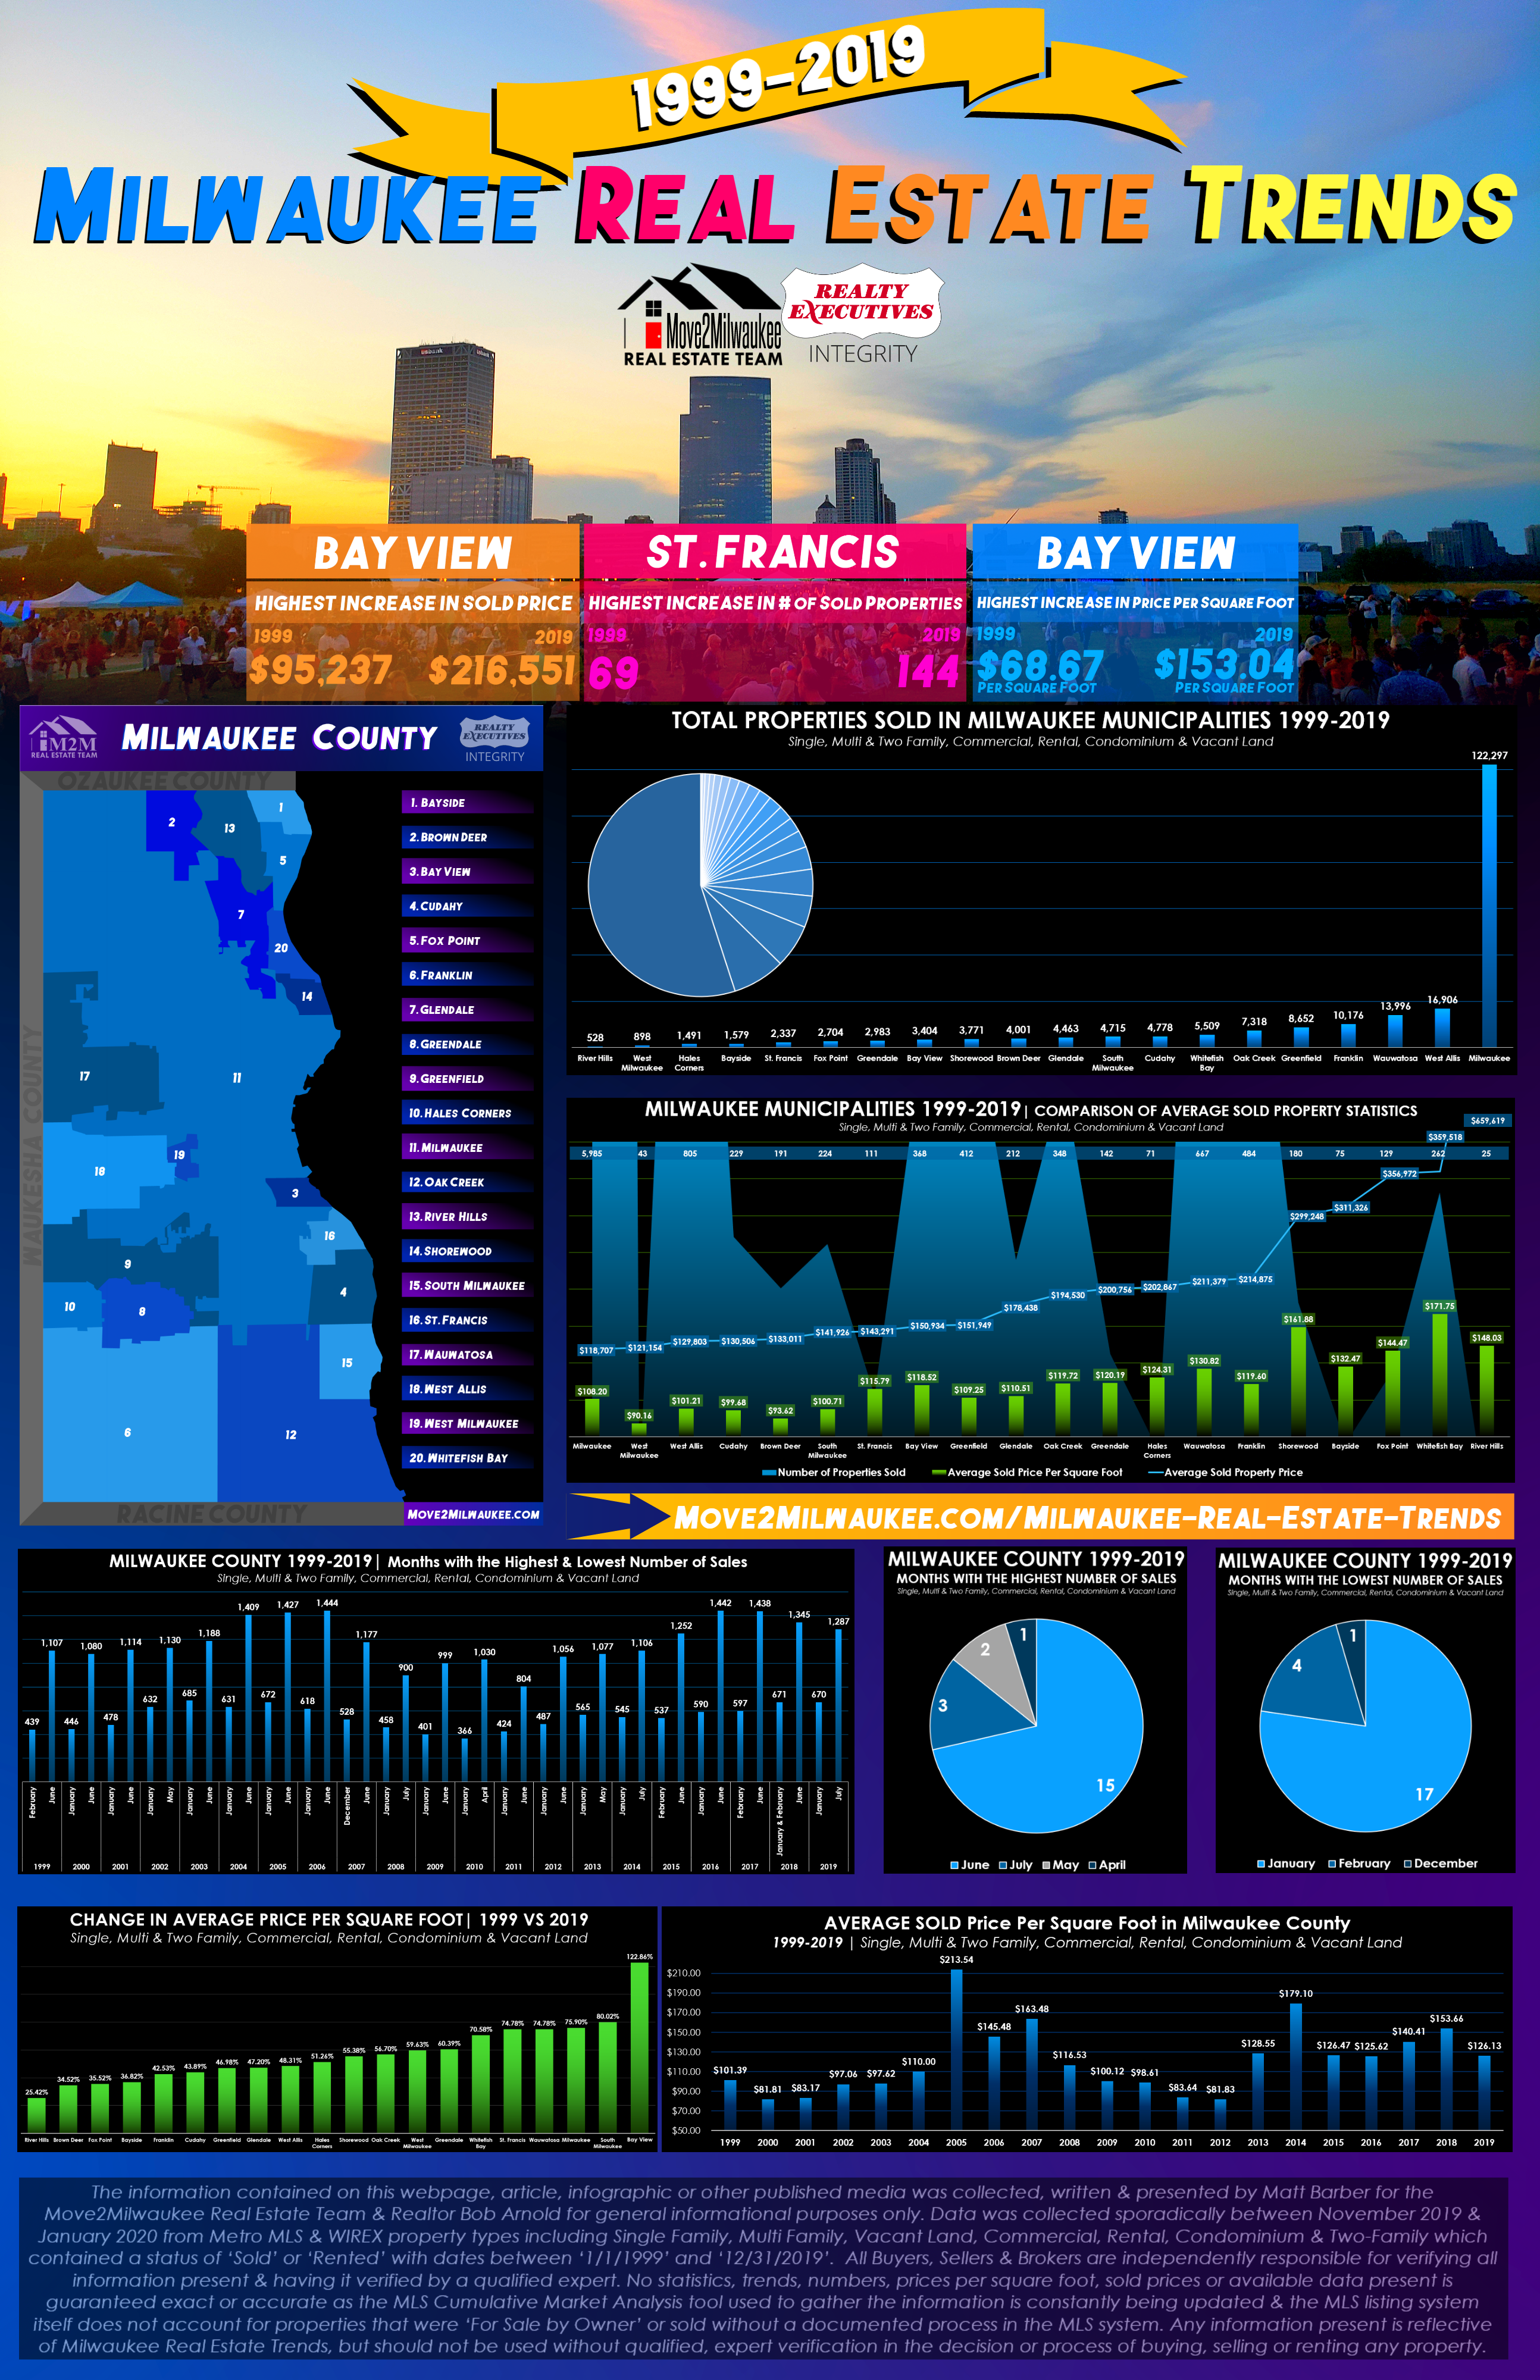
Milwaukee Real Estate Trends & Statistics: The Complete Guide to the Last 2 Decades of Milwaukee Real Estate Between 1999 & 2019. EVERYTHING you need to know for 2020 is tucked away in the last 20 years of local real estate.
Courtesy of Realtor Bob Arnold & the Move2Milwaukee Team of Realtors in collaboration with documented sales sourced from Milwaukee MetroMLS, view the Milwaukee real estate statistics & changes throughout Milwaukee County you need to help inform the property investment, selling timelines & home purchases you make this year.
*Right Click Any Image to Open in a New Tab for a Closer Look at Graphs

Navigate Milwaukee Real Estate Trends & Statistics
Discover 2 Decades of Milwaukee Real Estate: 1999-2019

Milwaukee County Highlights
Main Takeaways from 2 Decades of Milwaukee County Real Estate Trends & Statistics
Milwaukee Real Estate Statistics & Trends 1999 to 2019: Information overload. This section takes 2 decades of data & makes a long story short.
TIP: When viewing graphs, right click to open an image in a new tab to take a closer look.
County-Wide Data Highlights from 1999 to 2019
Milwaukee Average Sold Property Price | 1999-2019
(Scroll Down for The Detailed Statistical Chart)
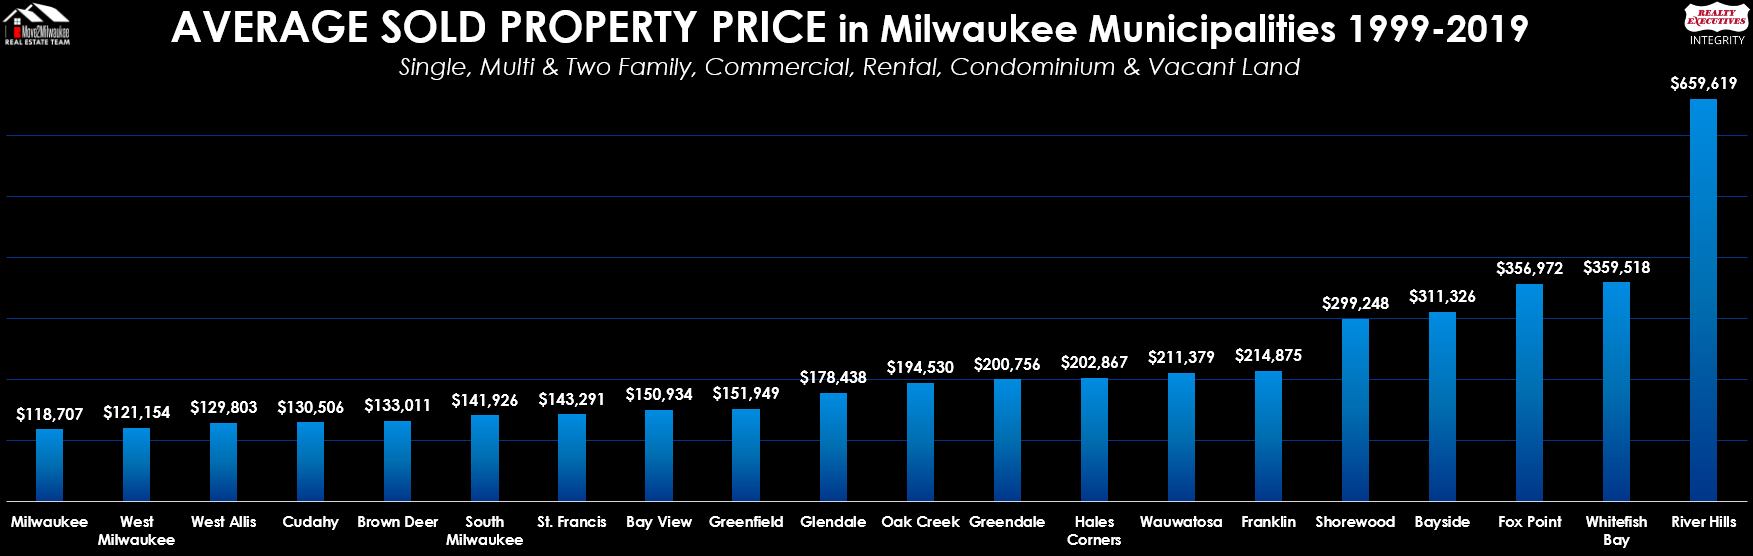
What is the average home price in Milwaukee? Based on data sourced from 1999 to 2019, the two graphs here showcase some of the largest averages available on property prices in Milwaukee County to give you an idea of the cost to live in each municipality.
Please note, these are not the average prices you see in municipalities today. The chart below the bottom graph gives more detail on current averages in each municipality.
Which parts of Milwaukee have grown the most in value? The graph below compares data from 1999 to 2019 to give the average increase in sold property price in each municipality. As you can see in both graphs from this section, River Hills has some of the highest sold prices & the lowest increase in average sold price. Bay View, on the other hand, has seen the largest increase in sold price while traditionally having more affordably priced properties available.
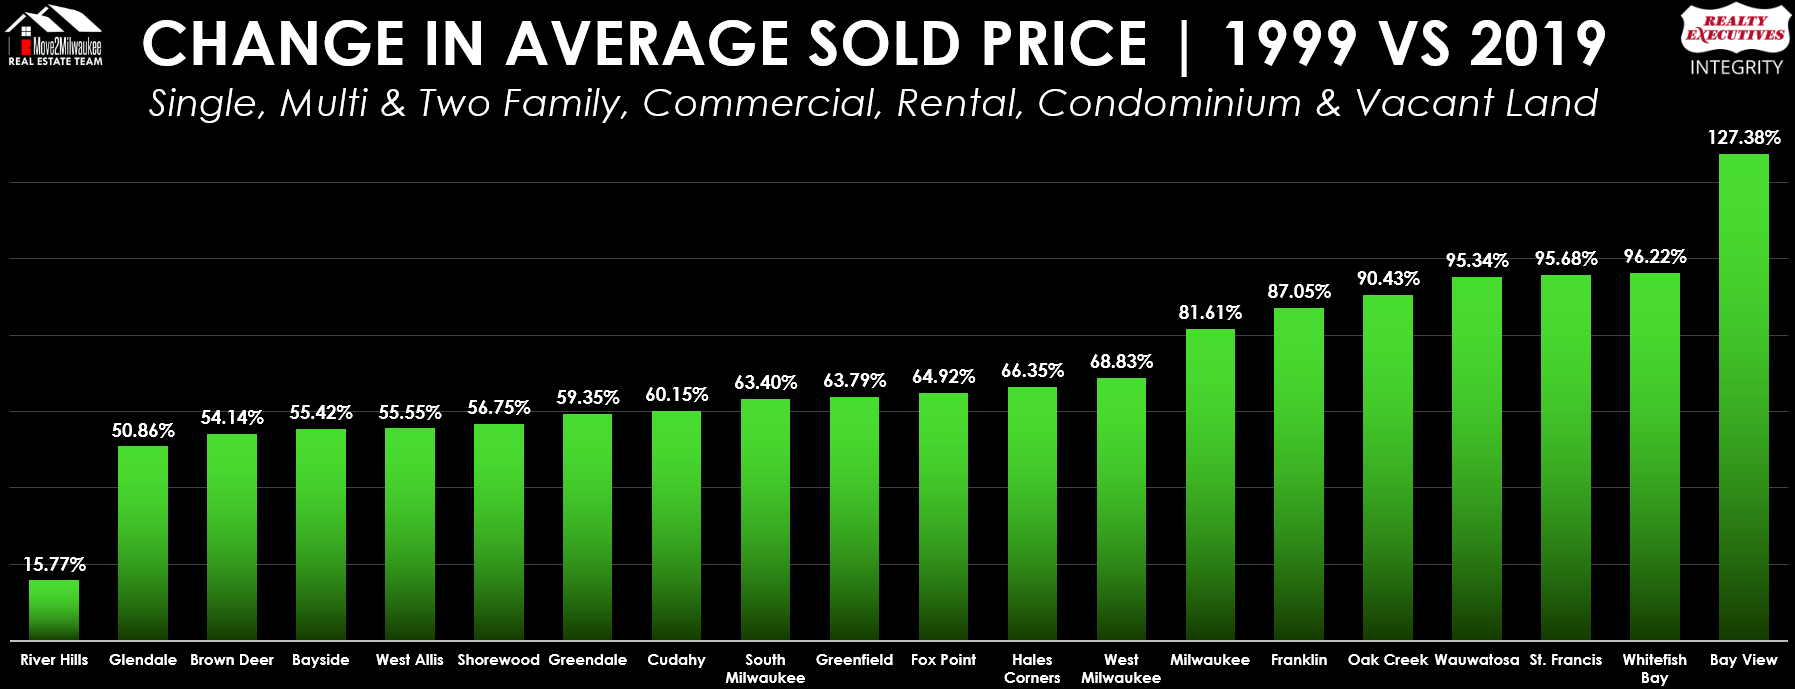
| Municipality | 1999 | 2019 | % Change |
|---|---|---|---|
| Bay View | $95,237 | $216,551 | 127.38% Increase |
| Whitefish Bay | $224,116 | $439,756 | 96.22% Increase |
| St. Francis | $95,782 | $187,426 | 95.68% Increase |
| Wauwatosa | $140,859 | $275,151 | 95.34% Increase |
| Oak Creek | $131,605 | $250,612 | 90.43% Increase |
| Franklin | $147,451 | $275,806 | 87.05% Increase |
| Milwaukee | $85,007 | $154,377 | 81.61% Increase |
| West Milwaukee | $88,878 | $150,056 | 68.83% Increase |
| Hales Corners | $153,449 | $255,267 | 66.35% Increase |
| Fox Point | $234,098 | $386,066 | 64.92% Increase |
| Greenfield | $119,706 | $196,072 | 63.79% Increase |
| South Milwaukee | $106,804 | $174,518 | 63.40% Increase |
| Cudahy | $104,361 | $167,137 | 60.15% Increase |
| Greendale | $158,331 | $252,304 | 59.35% Increase |
| Shorewood | $218,696 | $342,795 | 56.75% Increase |
| West Allis | $100,794 | $156,789 | 55.55% Increase |
| Bayside | $233,942 | $363,597 | 55.42% Increase |
| Brown Deer | $108,333 | $166,982 | 54.14% Increase |
| Glendale | $143,068 | $215,828 | 50.86% Increase |
| River Hills | $491,913 | $569,480 | 15.77% Increase |
Milwaukee Average Sold Price Per Square Foot | 1999-2019
(Scroll Down for The Detailed Statistical Chart)
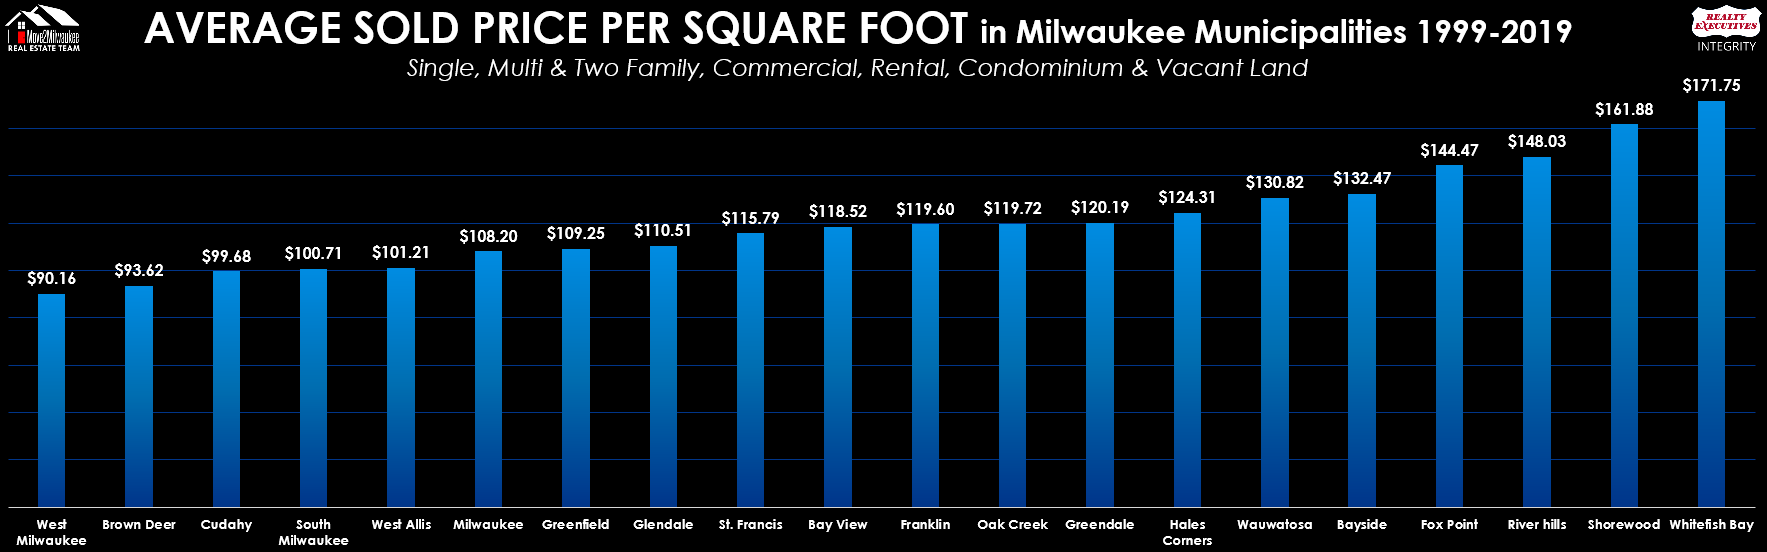
What is the average price per square foot in Milwaukee? Collecting data in each Milwaukee County municipality from 1999 to 2019, the above graph gives home buyers & sellers a look at the average sold price per square foot.
Please note, these are not the average prices you see in municipalities today. The chart below the bottom graph gives more detail on current averages in each municipality.
Which parts of Milwaukee have seen the best increase in price per square foot? The graph below takes the average sold price per square foot in 1999 vs 2019 for each municipality. As you can see in the graphs above & below, Bay View has traditionally been priced in the middle of other municipalities while seeing one of the highest increases in Milwaukee County in 2 decades. River Hills, on the other hand, has the lowest increase in sold price per square foot between 1999 & 2019, but is the third highest when it comes to sold price per square foot.
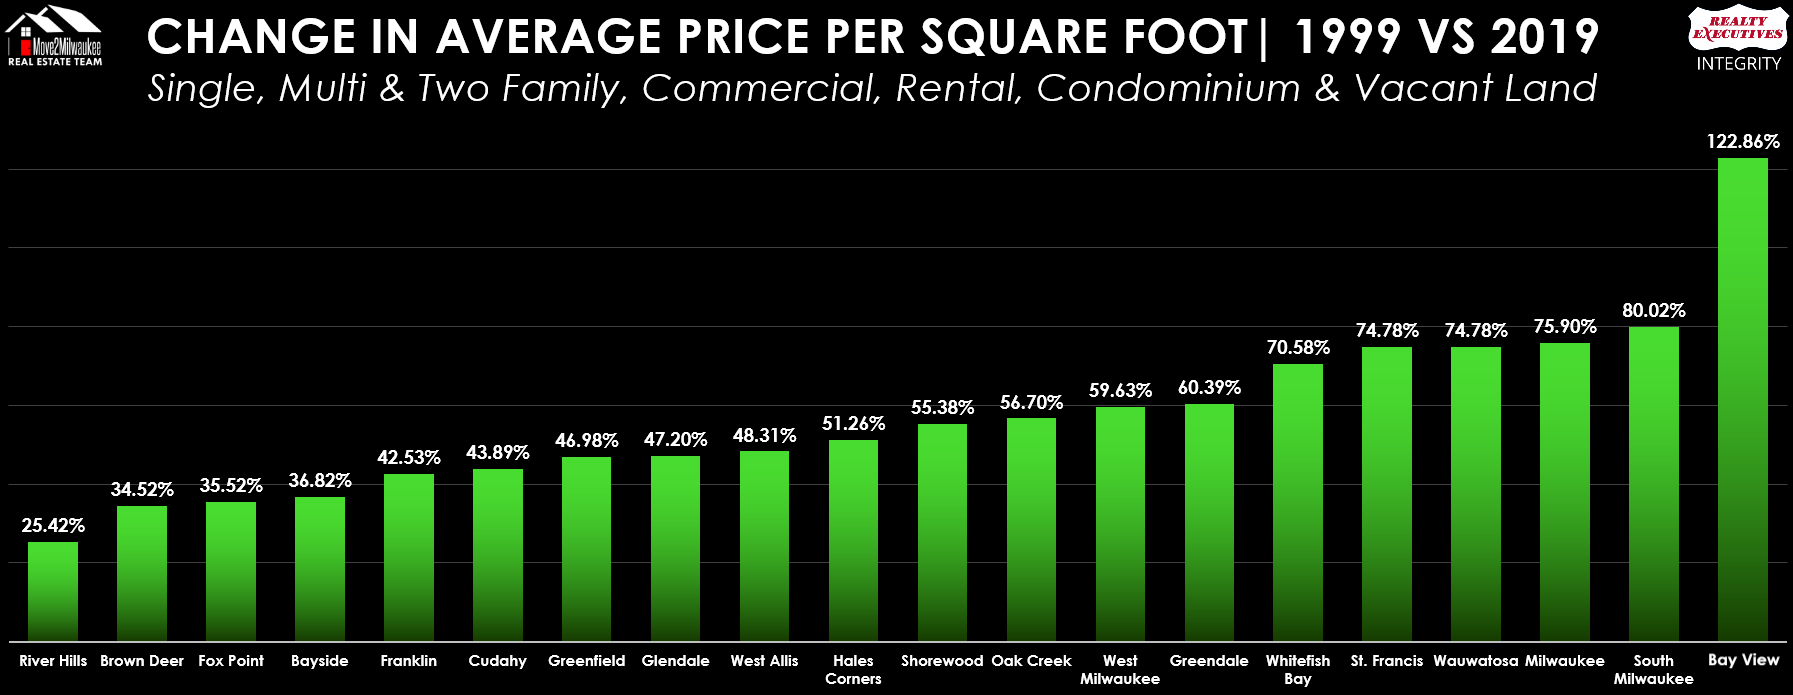
| Municipality | 1999 Price Per Sq. Ft. | 2019 Price Per Sq. Ft. | % Change |
|---|---|---|---|
| Bay View | $68.67 | $153.04 | 122.86% Increase |
| South Milwaukee | $68.11 | $122.61 | 80.02% Increase |
| Milwaukee | $62.86 | $111.75 | 77.78% Increase |
| Wauwatosa | $91.59 | $161.11 | 75.90% Increase |
| St. Francis | $82.98 | $145.04 | 74.78% Increase |
| Whitefish Bay | $115.25 | $196.59 | 70.58% Increase |
| Greendale | $90.15 | $144.59 | 60.39% Increase |
| West Milwaukee | $70.37 | $112.54 | 59.93% Increase |
| Oak Creek | $91.24 | $142.97 | 56.70% Increase |
| Shorewood | $116.74 | $181.39 | 55.38% Increase |
| Hales Corners | $97.10 | $146.87 | 51.26% Increase |
| West Allis | $82.20 | $121.91 | 48.31% Increase |
| Glendale | $86.49 | $127.31 | 47.20% Increase |
| Greenfield | $88.33 | $129.83 | 46.98% Increase |
| Cudahy | $81.07 | $116.65 | 43.89% Increase |
| Franklin | $91.01 | $129.72 | 42.53% Increase |
| Bayside | $107.99 | $147.75 | 36.82% Increase |
| Fox Point | $113.96 | $154.44 | 35.52% Increase |
| Brown Deer | $78.95 | $106.20 | 34.52% Increase |
| River Hills | $105.65 | $132.51 | 25.42% Increase |
Average Home Size in Milwaukee | 1999-2019
(Scroll Down for The Detailed Statistical Chart)
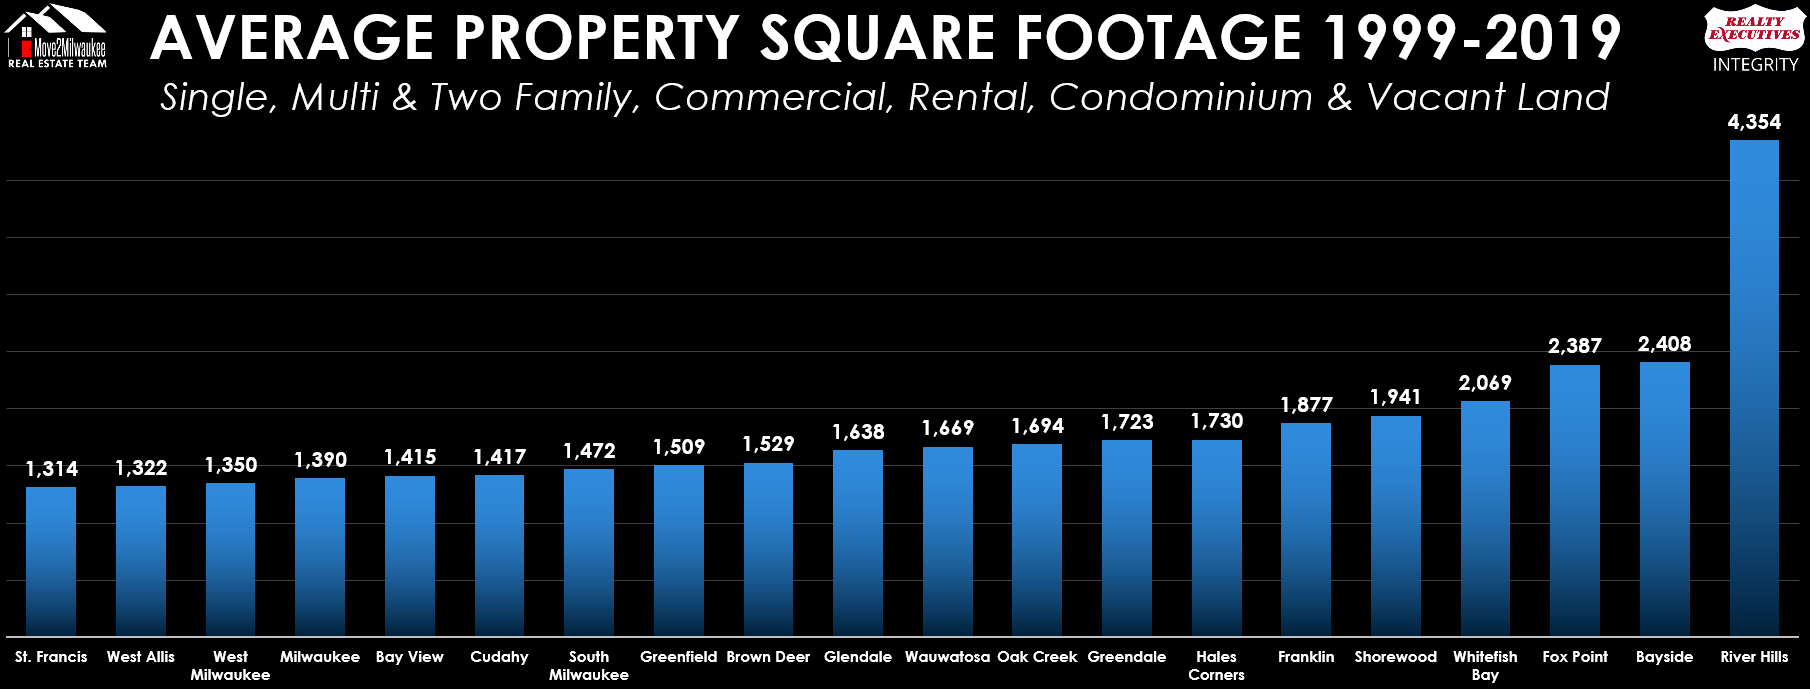
What is the average size of a house in Milwaukee County? We’ve charted data for all our municipalities between 1999 & 2019 to get these rough estimates on average home sizes in the area. As you can see above (and below), River Hills has historically had some of the largest constructed buildings or homes on a property while St. Francis & West Allis have some of the smallest.
| Municipality | Average Property Square Footage |
|---|---|
| River Hills | 4,354 |
| Bayside | 2,408 |
| Fox Point | 2,387 |
| Whitefish Bay | 2,069 |
| Shorewood | 1,941 |
| Franklin | 1,877 |
| Hales Corners | 1,730 |
| Greendale | 1,723 |
| Oak Creek | 1,694 |
| Wauwatosa | 1,669 |
| Glendale | 1,638 |
| Brown Deer | 1,529 |
| Greenfield | 1,509 |
| South Milwaukee | 1,472 |
| Cudahy | 1,417 |
| Bay View | 1,415 |
| Milwaukee | 1,390 |
| West Milwaukee | 1,350 |
| West Allis | 1,322 |
| St. Francis | 1,314 |
Milwaukee Average Properties Sold | 1999-2019
(Scroll Down for The Detailed Statistical Chart)
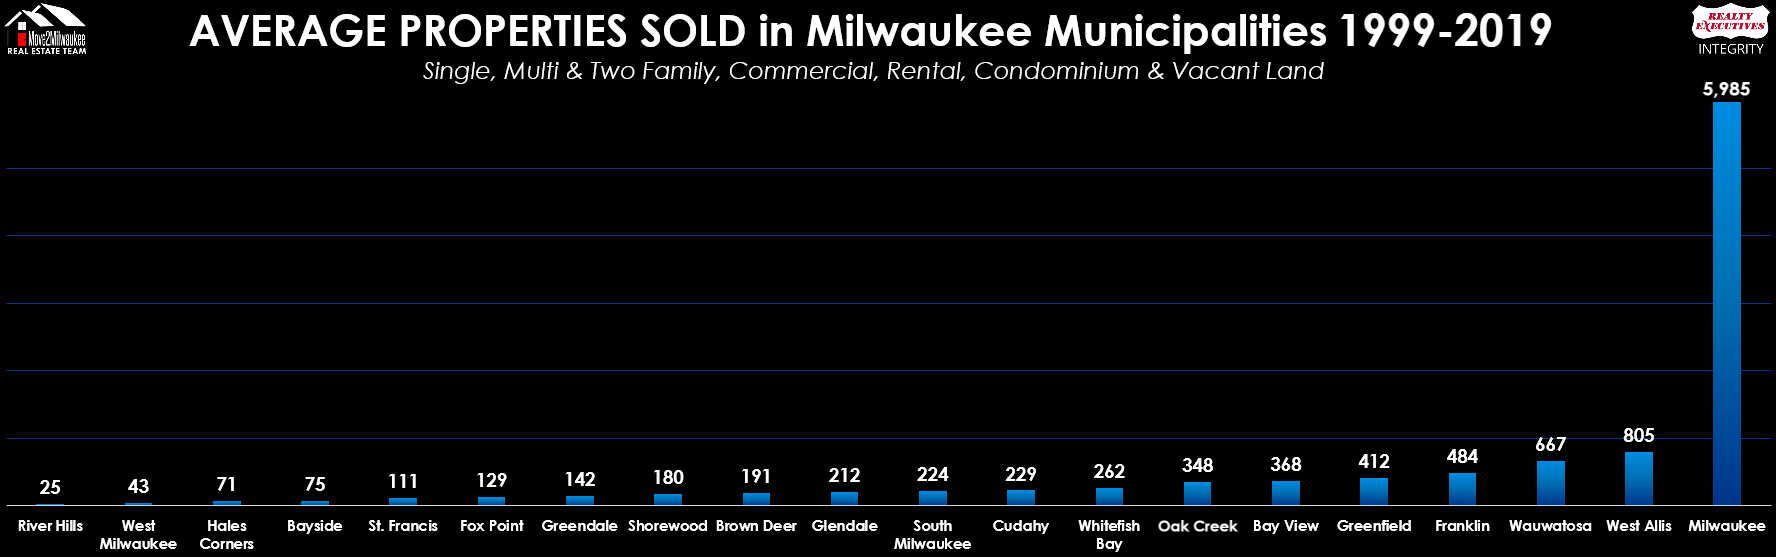
How many properties sell every year in Milwaukee, Wisconsin? The graph above outlines the number of properties, on average, sold every year in each municipality of Milwaukee County from 1999 to 2019. Some clearly have higher turnover while others are more exclusive. This comes down to a number of factors such as parcel size, investment opportunity, municipality amenities & more!
Please note, these are not the average number of sold properties you see in municipalities today. The chart below the bottom graph gives more detail on current averages in each municipality.
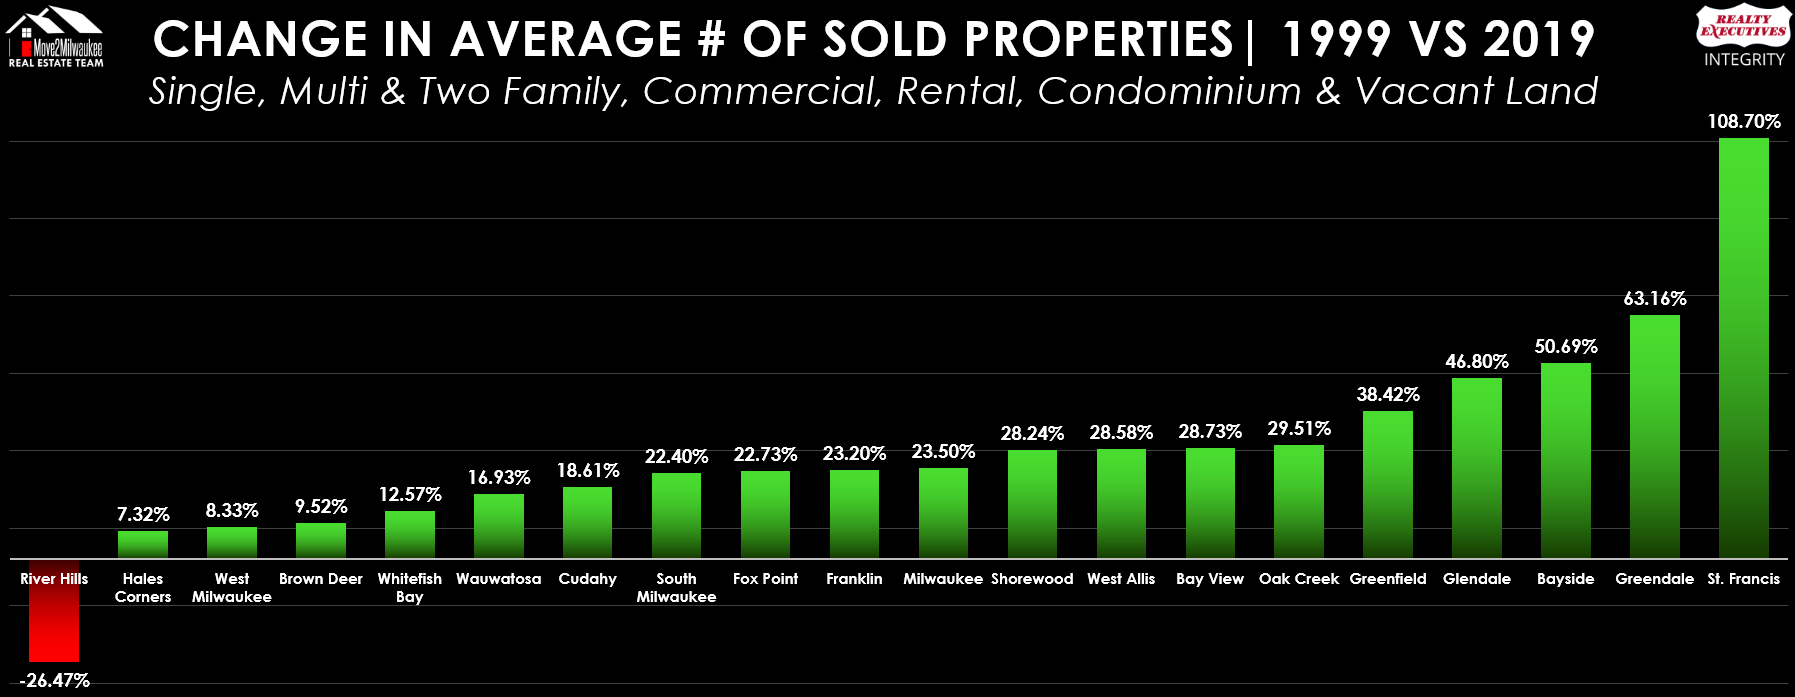
Which parts of Milwaukee are homes selling fast? Taking numbers from 1999 & 2019, we’ve compared the two years for each municipality when it comes to their yearly number of sold properties. As you can see, River Hills is the ONLY municipality to see a decrease in the number of properties sold while municipalities like Greenfield, Glendale, Bayside, Greendale &, most notably, St. Francis see remarkable jumps in their yearly number of sold properties.
| Municipality | 1999 # of Sold Listings | 2019 # of Sold Listings | % Change |
|---|---|---|---|
| St. Francis | 69 | 144 | 108.70% Increase |
| Greendale | 114 | 186 | 63.16% Increase |
| Bayside | 73 | 110 | 50.69% Increase |
| Glendale | 201 | 295 | 46.80% Increase |
| Greenfield | 367 | 508 | 38.42% Increase |
| Oak Creek | 305 | 395 | 29.51% Increase |
| Bay View | 181 | 233 | 28.73% Increase |
| West Allis | 773 | 994 | 28.58% Increase |
| Shorewood | 170 | 218 | 28.24% Increase |
| Milwaukee | 5,277 | 6,517 | 23.50% Increase |
| Franklin | 444 | 547 | 23.20% Increase |
| Fox Point | 132 | 162 | 22.73% Increase |
| South Milwaukee | 192 | 235 | 22.40% Increase |
| Cudahy | 258 | 306 | 18.61% Increase |
| Wauwatosa | 709 | 829 | 16.93% Increase |
| Whitefish Bay | 292 | 329 | 12.67% Increase |
| Brown Deer | 210 | 230 | 9.52% Increase |
| West Milwaukee | 48 | 52 | 8.33% Increase |
| Hales Corners | 82 | 88 | 7.32% Increase |
| River Hills | 34 | 25 | 26.47% Decrease |
Milwaukee Statistics: Overview | 1999-2019
This section is exclusively dedicated to complete Milwaukee County real estate statistical data & averages. Under each graph there will be a chart outlining the statistical data in more detail. If you have any questions regarding any of the data, please contact Realtor Bob Arnold or our team of Milwaukee Realtors for more info: 414-379-1101
TIP: You can right click any graph on this page to open the image in a new tab for a closer look!
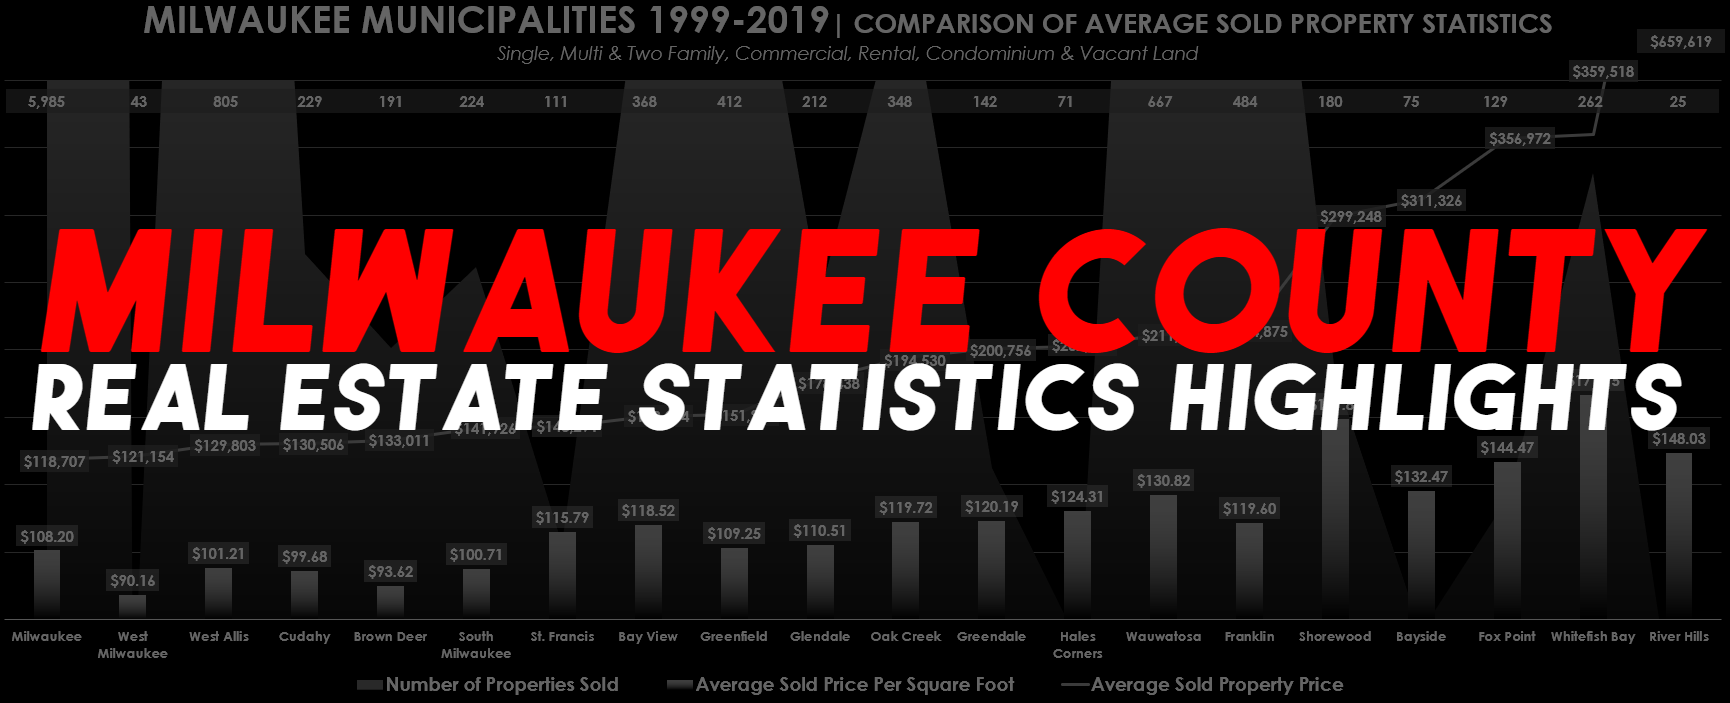
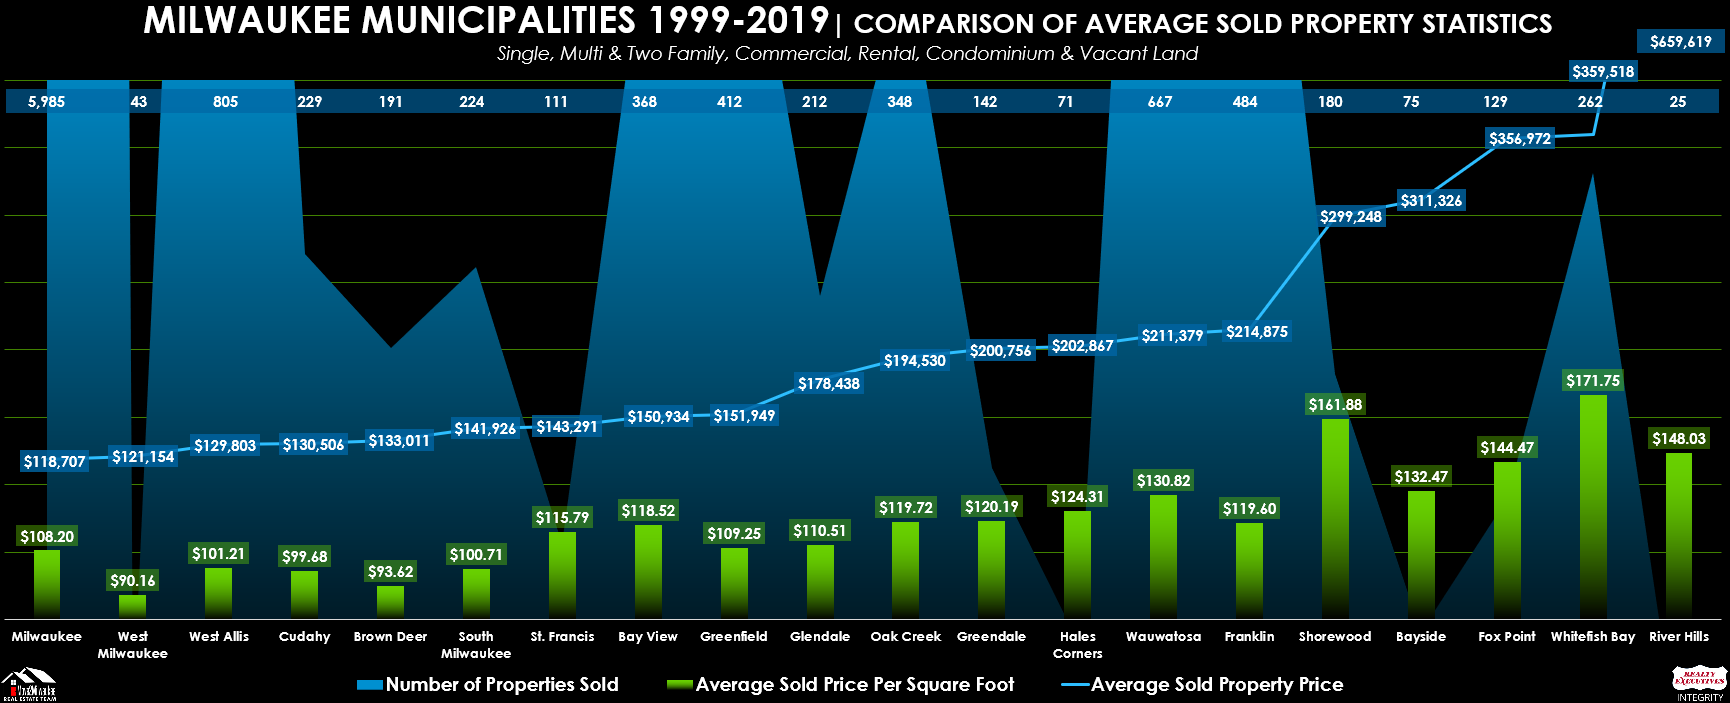
Comparison of Average Sold Property Statistics in Milwaukee Municipalities
The graph & chart below compares the average number of properties sold, price per square foot & average sold property price in each municipality from 1999 to 2019! Please note, the municipalities are listed respectively. Continue scrolling for more Milwaukee County Total Look graphs or head back to the top to browse by Municipality!
| Municipality | 1999 | 2019 | % Change |
|---|---|---|---|
| Bay View | $95,237 | $216,551 | 127.38% Increase |
| Whitefish Bay | $224,116 | $439,756 | 96.22% Increase |
| St. Francis | $95,782 | $187,426 | 95.68% Increase |
| Wauwatosa | $140,859 | $275,151 | 95.34% Increase |
| Oak Creek | $131,605 | $250,612 | 90.43% Increase |
| Franklin | $147,451 | $275,806 | 87.05% Increase |
| Milwaukee | $85,007 | $154,377 | 81.61% Increase |
| West Milwaukee | $88,878 | $150,056 | 68.83% Increase |
| Hales Corners | $153,449 | $255,267 | 66.35% Increase |
| Fox Point | $234,098 | $386,066 | 64.92% Increase |
| Greenfield | $119,706 | $196,072 | 63.79% Increase |
| South Milwaukee | $106,804 | $174,518 | 63.40% Increase |
| Cudahy | $104,361 | $167,137 | 60.15% Increase |
| Greendale | $158,331 | $252,304 | 59.35% Increase |
| Shorewood | $218,696 | $342,795 | 56.75% Increase |
| West Allis | $100,794 | $156,789 | 55.55% Increase |
| Bayside | $233,942 | $363,597 | 55.42% Increase |
| Brown Deer | $108,333 | $166,982 | 54.14% Increase |
| Glendale | $143,068 | $215,828 | 50.86% Increase |
| River Hills | $491,913 | $569,480 | 15.77% Increase |
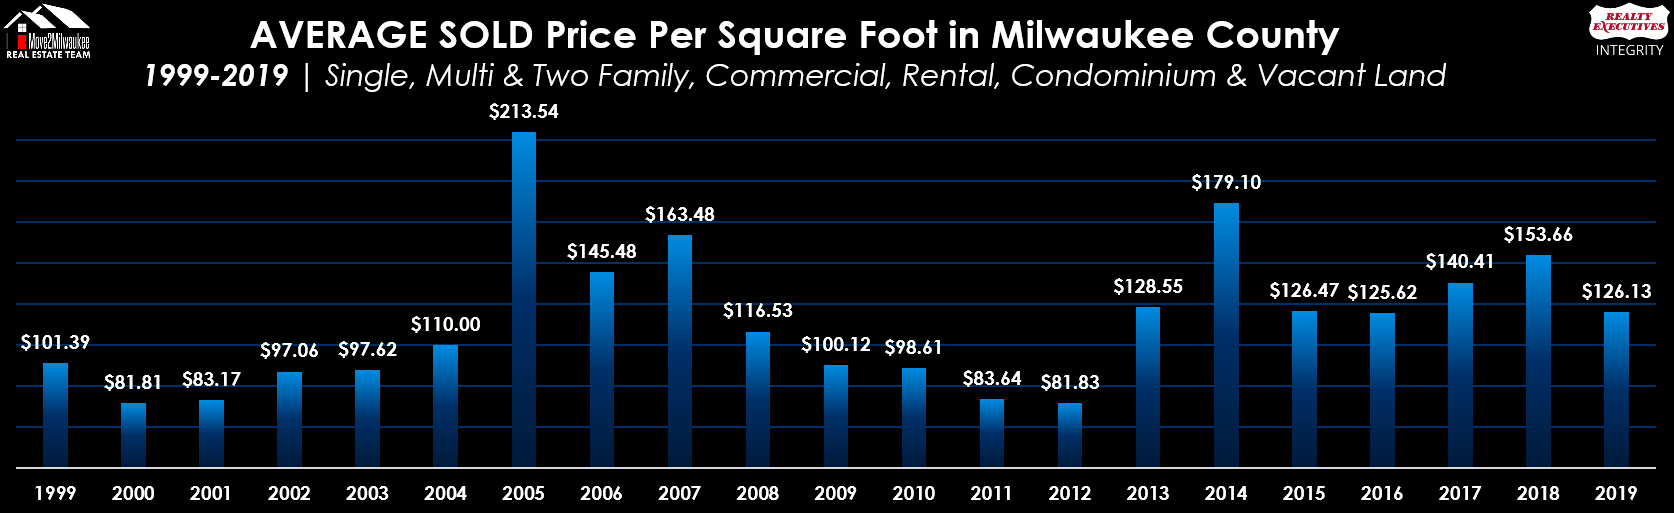
Average SOLD Price Per Square Foot in Milwaukee County 1999-2019
This graph showcases the collective average sold price per square foot of every sold property in Milwaukee County from 1999 to 2019.
Total Properties SOLD in Milwaukee County 1999-2019
This graph showcases the TOTAL number of sold properties in Milwaukee County every year from 1999 to 2019.
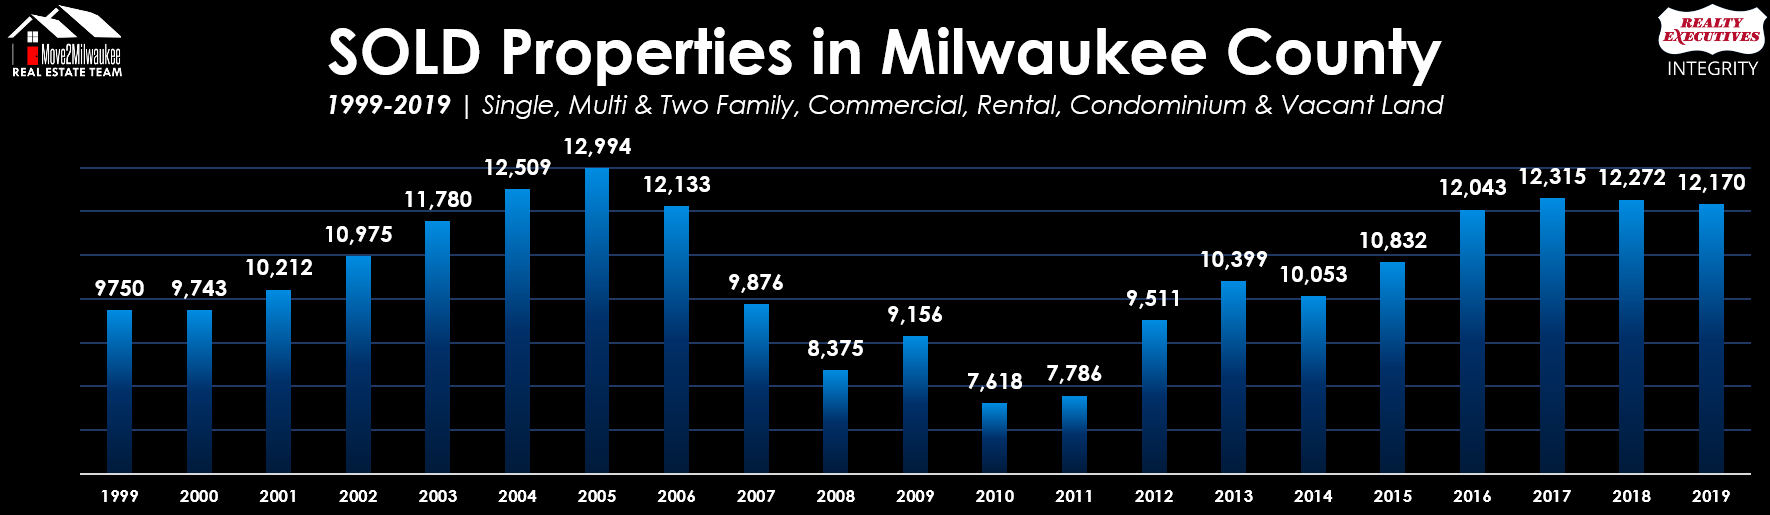
| Year | Average Sold Price Per Square Foot | Number of Properties Sold |
|---|---|---|
| 2019 | $126.13 | 12,170 |
| 2018 | $153.66 | 12,272 |
| 2017 | $140.41 | 12,315 |
| 2016 | $125.62 | 12,043 |
| 2015 | $126.47 | 10,832 |
| 2014 | $179.10 | 10,053 |
| 2013 | $128.55 | 10,399 |
| 2012 | $81.83 | 9,511 |
| 2011 | $83.64 | 7,786 |
| 2010 | $98.61 | 7,618 |
| 2009 | $100.12 | 9,156 |
| 2008 | $116.53 | 8,375 |
| 2007 | $163.48 | 9,876 |
| 2006 | $145.48 | 12,133 |
| 2005 | $213.54 | 12,994 |
| 2004 | $110.00 | 12,509 |
| 2003 | $97.62 | 11,780 |
| 2002 | $97.06 | 10,975 |
| 2001 | $83.17 | 10,212 |
| 2000 | $81.81 | 9,743 |
| 1999 | $101.39 | 9,750 |
Total Properties SOLD in Milwaukee Municipalities 1999-2019
This graph & chart showcases the TOTAL number of sold properties in each municipality from 1999 to 2019!
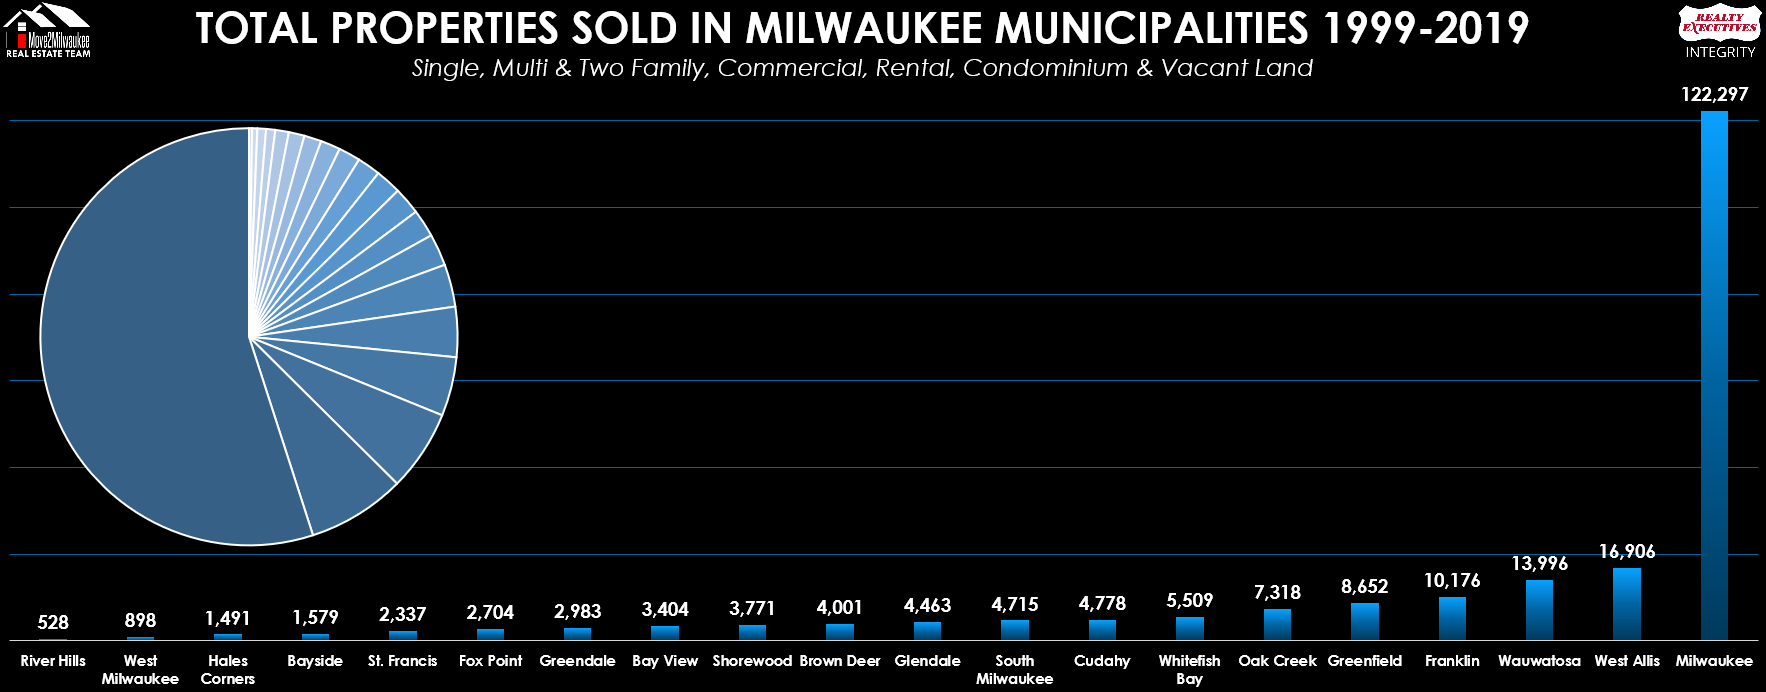
| Municipality | Total Properties Sold 1999-2019 |
|---|---|
| Milwaukee | 122,297 |
| West Allis | 16,906 |
| Wauwatosa | 13,996 |
| Franklin | 10,176 |
| Greenfield | 8,652 |
| Oak Creek | 7,318 |
| Whitefish Bay | 5,509 |
| Cudahy | 4,778 |
| South Milwaukee | 4,715 |
| Glendale | 4,463 |
| Brown Deer | 4,001 |
| Shorewood | 3,771 |
| Bay View | 3,404 |
| Greendale | 2,983 |
| Fox Point | 2,704 |
| St. Francis | 2,337 |
| Bayside | 1,579 |
| Hales Corners | 1,491 |
| West Milwaukee | 898 |
| River Hills | 528 |

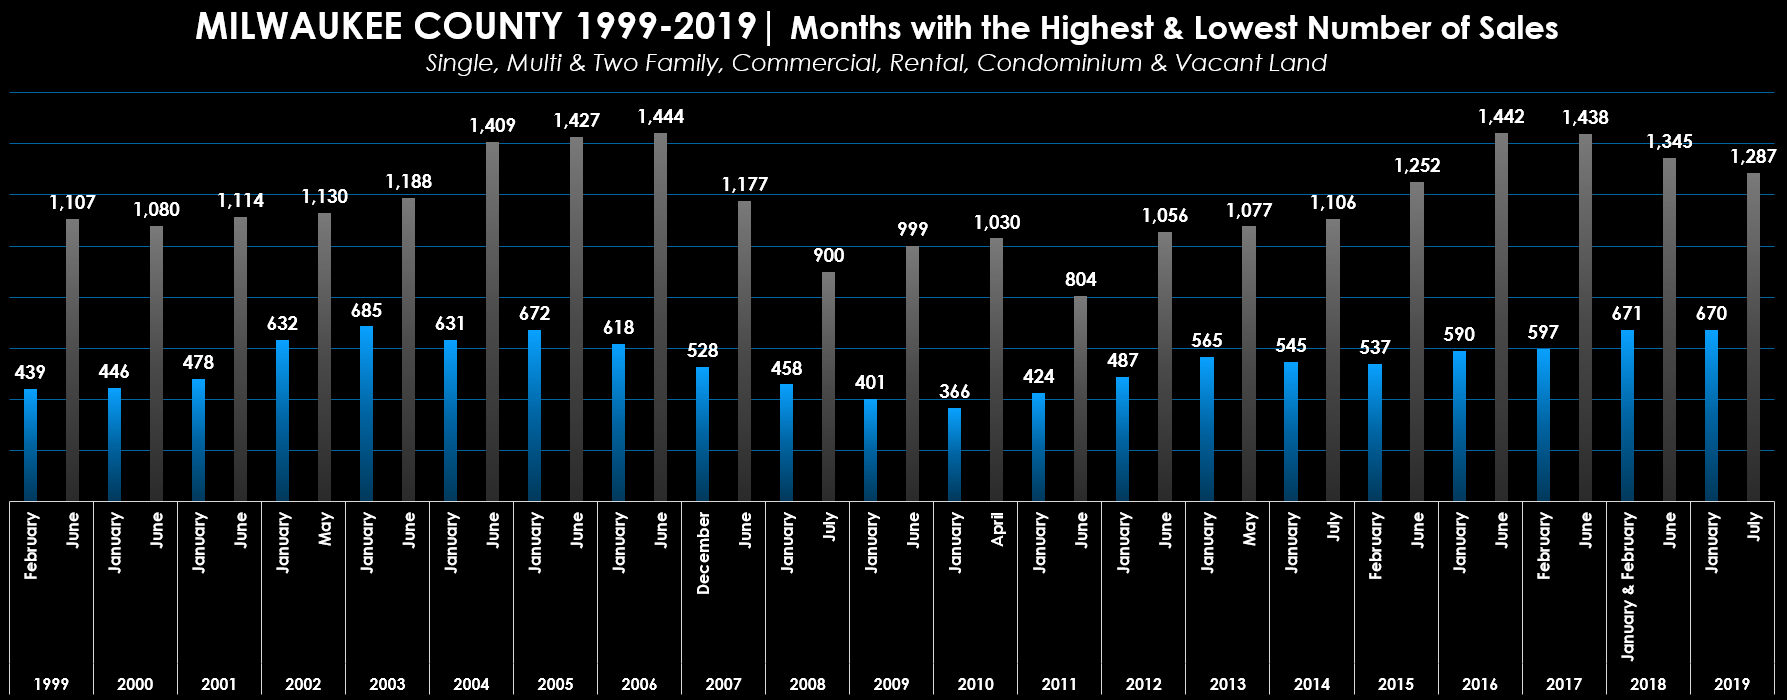
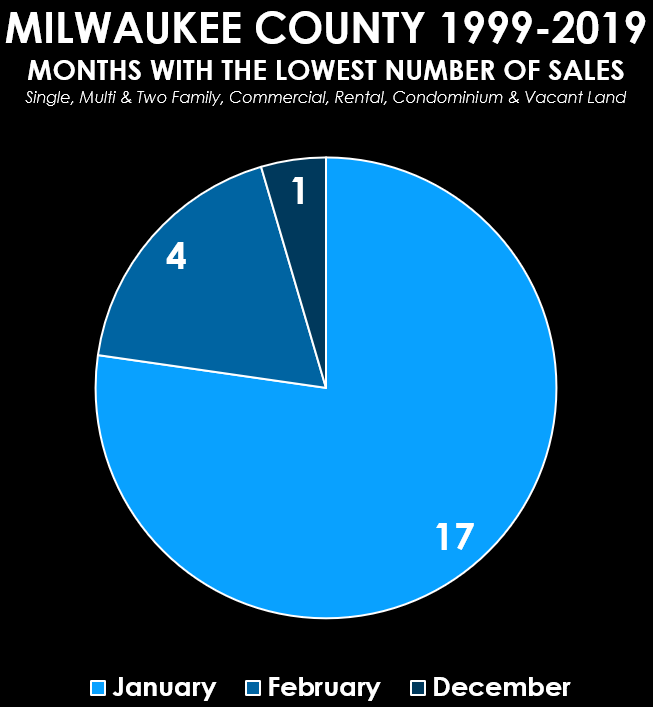
When is the Best Time to Buy a Home in Milwaukee?
Based on the Last 2 Decades of Milwaukee Real Estate Statistics, THIS is When You Should be Looking at Homes!
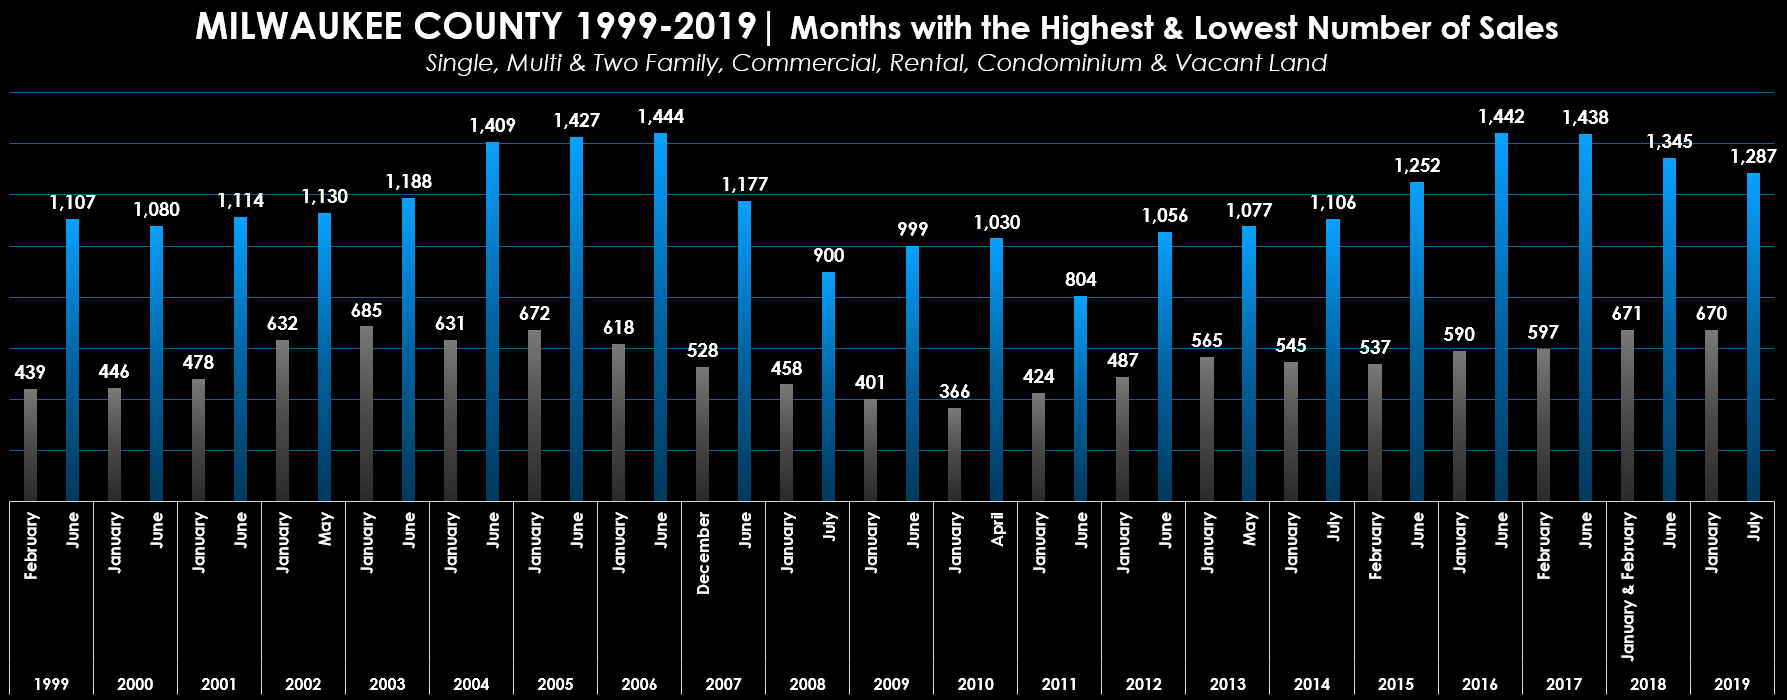
The best time to buy a home in Milwaukee comes down to taking advantage of the market. As a future homeowner, you will benefit the MOST if you start your home search when others are ending theirs. In the graph below, we’ve outlined the months with the lowest number of sales for every year 1999 to 2019. The blue bars represent the numbers buyers want to pay attention to. As you can see, January, February & December have had the lowest number of sold homes.
Realtor Bob Arnold recommends buyers START their home search in November or December. (Keep in mind, it takes about 30 days minimum to close on a home AFTER you receive an Accepted Offer!) This gives you time to look for your home & to hopefully place an offer before the Spring market hits in late February & early March.
Milwaukee Realtors Know The Best Time to Buy
(Right Click to Open the Image Above in a New Tab to Get a Closer Look!)
| Year | Month with Lowest Sales | Number of Properties Sold |
|---|---|---|
| 2019 | January | 670 |
| 2018 | January & February (Tie) | 671 |
| 2017 | February | 597 |
| 2016 | January | 590 |
| 2015 | February | 537 |
| 2014 | January | 545 |
| 2013 | January | 565 |
| 2012 | January | 487 |
| 2011 | January | 424 |
| 2010 | January | 366 |
| 2009 | January | 401 |
| 2008 | January | 458 |
| 2007 | December | 528 |
| 2006 | January | 618 |
| 2005 | January | 672 |
| 2004 | January | 631 |
| 2003 | January | 685 |
| 2002 | January | 632 |
| 2001 | January | 478 |
| 2000 | January | 446 |
| 1999 | February | 439 |

When is the Best Time to Sell a Home in Milwaukee?
Listing Your Home is All About Exposure & Strategy – Based on the Last 20 Years, this is When You Should Have your Home on the Market!
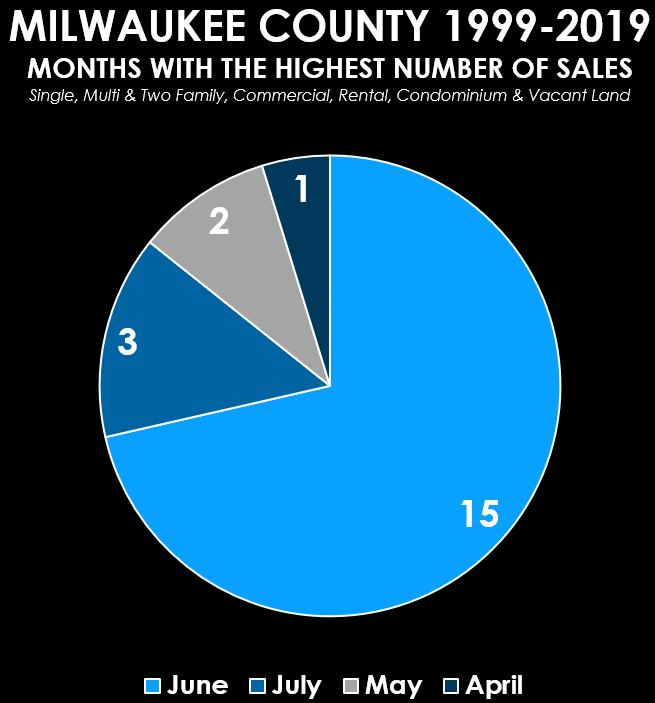
The best time to sell a home in Milwaukee, Wisconsin? Our Team of Milwaukee Realtors know it’s all about working with some of the best while listing during the most opportune time. Outlined in the graph below, we’ve highlighted the months with the highest number of sales every since from 1999 to 2019. The blue bars are the numbers sellers will want to pay special attention to. May, April, June & July are historically some of the strongest months for home sales in Milwaukee County.
Realtor Bob Arnold recommends sellers LIST their homes in March or April for maximized exposure during the Spring Market. (Keep in mind, you can list your home any time of the year, but homes that are listed later than June will likely be on the market longer.)
Find the Best Time to Sell with our Team of Milwaukee Realtors
(Right Click to Open the Image Above in a New Tab to Get a Closer Look!)
| Year | Month with Highest Sales | Number of Properties Sold |
|---|---|---|
| 2019 | July | 1,287 |
| 2018 | June | 1,345 |
| 2017 | June | 1,438 |
| 2016 | June | 1,442 |
| 2015 | June | 1,252 |
| 2014 | July | 1,106 |
| 2013 | May | 1,077 |
| 2012 | June | 1,056 |
| 2011 | June | 804 |
| 2010 | April | 1,030 |
| 2009 | June | 999 |
| 2008 | July | 900 |
| 2007 | June | 1,177 |
| 2006 | June | 1,444 |
| 2005 | June | 1,427 |
| 2004 | June | 1,409 |
| 2003 | June | 1,188 |
| 2002 | May | 1,130 |
| 2001 | June | 1,114 |
| 2000 | June | 1,080 |
| 1999 | June | 1,107 |
Milwaukee Real Estate Trends: 2020
An Update & Official COVID-19 Response from the Move2Milwaukee Team of Milwaukee Realtors
2020 is shaping up to be a very unique year for Milwaukee Real Estate. We’ve included a chart below the video of current Milwaukee Real Estate Statistics in 2020 for you to check in on.
COVID-19 is also undoubtedly part of the conversation. In Wisconsin, Real Estate Services have been deemed essential & our team of Milwaukee Realtors are committed to serving our buyers’ & sellers’ needs to the best of our abilities.
Please check out the video below & read our Official COVID-19 in Milwaukee Real Estate statement for more information on how we’re addressing this challenge.
Wisconsin is Home. For All of Us.

Milwaukee Real Estate Statistics: 2020 Update
The chart below covers sold property data for all Milwaukee municipalities between January 1st, 2020 & March 31st, 2020. It was last updated April 7th, 2020.
| Municipality | Average Sold Price | Avg. Sold Price Per Square Foot | # of Sold Properties |
|---|---|---|---|
| Bayside | $381,379 | $146.25 | 19 |
| Brown Deer | $167,444 | $112.97 | 45 |
| Cudahy | $162,200 | $127.61 | 46 |
| Fox Point | $369,128 | $150.84 | 23 |
| Franklin | $300,690 | $153.55 | 101 |
| Glendale | $230,129 | $126.49 | 40 |
| Greendale | $229,055 | $140.34 | 29 |
| Greenfield | $205,417 | $126.62 | 94 |
| Hales Corners | $255,975 | $168.62 | 16 |
| Milwaukee | $159,979 | $112.49 | 1,305 |
| Oak Creek | $232,318 | $140.17 | 68 |
| River Hills | $684,556 | $118.07 | 8 |
| St. Francis | $195,609 | $145.35 | 26 |
| Shorewood | $459,771 | $205.37 | 43 |
| South Milwaukee | $192,741 | $122.81 | 49 |
| Wauwatosa | $255,129 | $152.95 | 158 |
| West Allis | $154,385 | $120.49 | 166 |
| West Milwaukee | $154,111 | $115.57 | 9 |
| Whitefish Bay | $510,287 | $218.89 | 53 |
All buyers & sellers should confirm the information on this page with a certified expert before making any personal or professional real estate decisions. If you have any questions regarding the data below or you would like to request a Free Market Evaluation on Your Home, please contact Realtor Bob Arnold at 414-379-1101
Bayside Real Estate Statistics
A Comprehensive Breakdown of Real Estate Trends & Statistics for Bayside, Wisconsin from 1999 to 2019
With the average home having an estimated 2,408 of livable square feet, Bayside, Wisconsin is one of Milwaukee County’s more competitive Municipalities. Just south of the neighboring Ozaukee County, Bayside has seen some of the slowest growth among municipalities & neighborhoods in Milwaukee.
This is reflective of a market where the properties owned are more often by people who occupy them as a permanent residence. In other words, one is less likely to find rental or commercial properties in Bayside, Wisconsin & the turnover tends to be lower. (A trend that noticeably changed the last two years during two strong sellers’ markets!)
Population | 4,389
Zip Codes | 53217
Median Household Income | $99,125
Main Attraction | Schlitz Audubon Nature Center
Average Home Square Footage (1999-2019) | 2,408 Est. Sq. Ft.
Borders Lake Michigan | YES
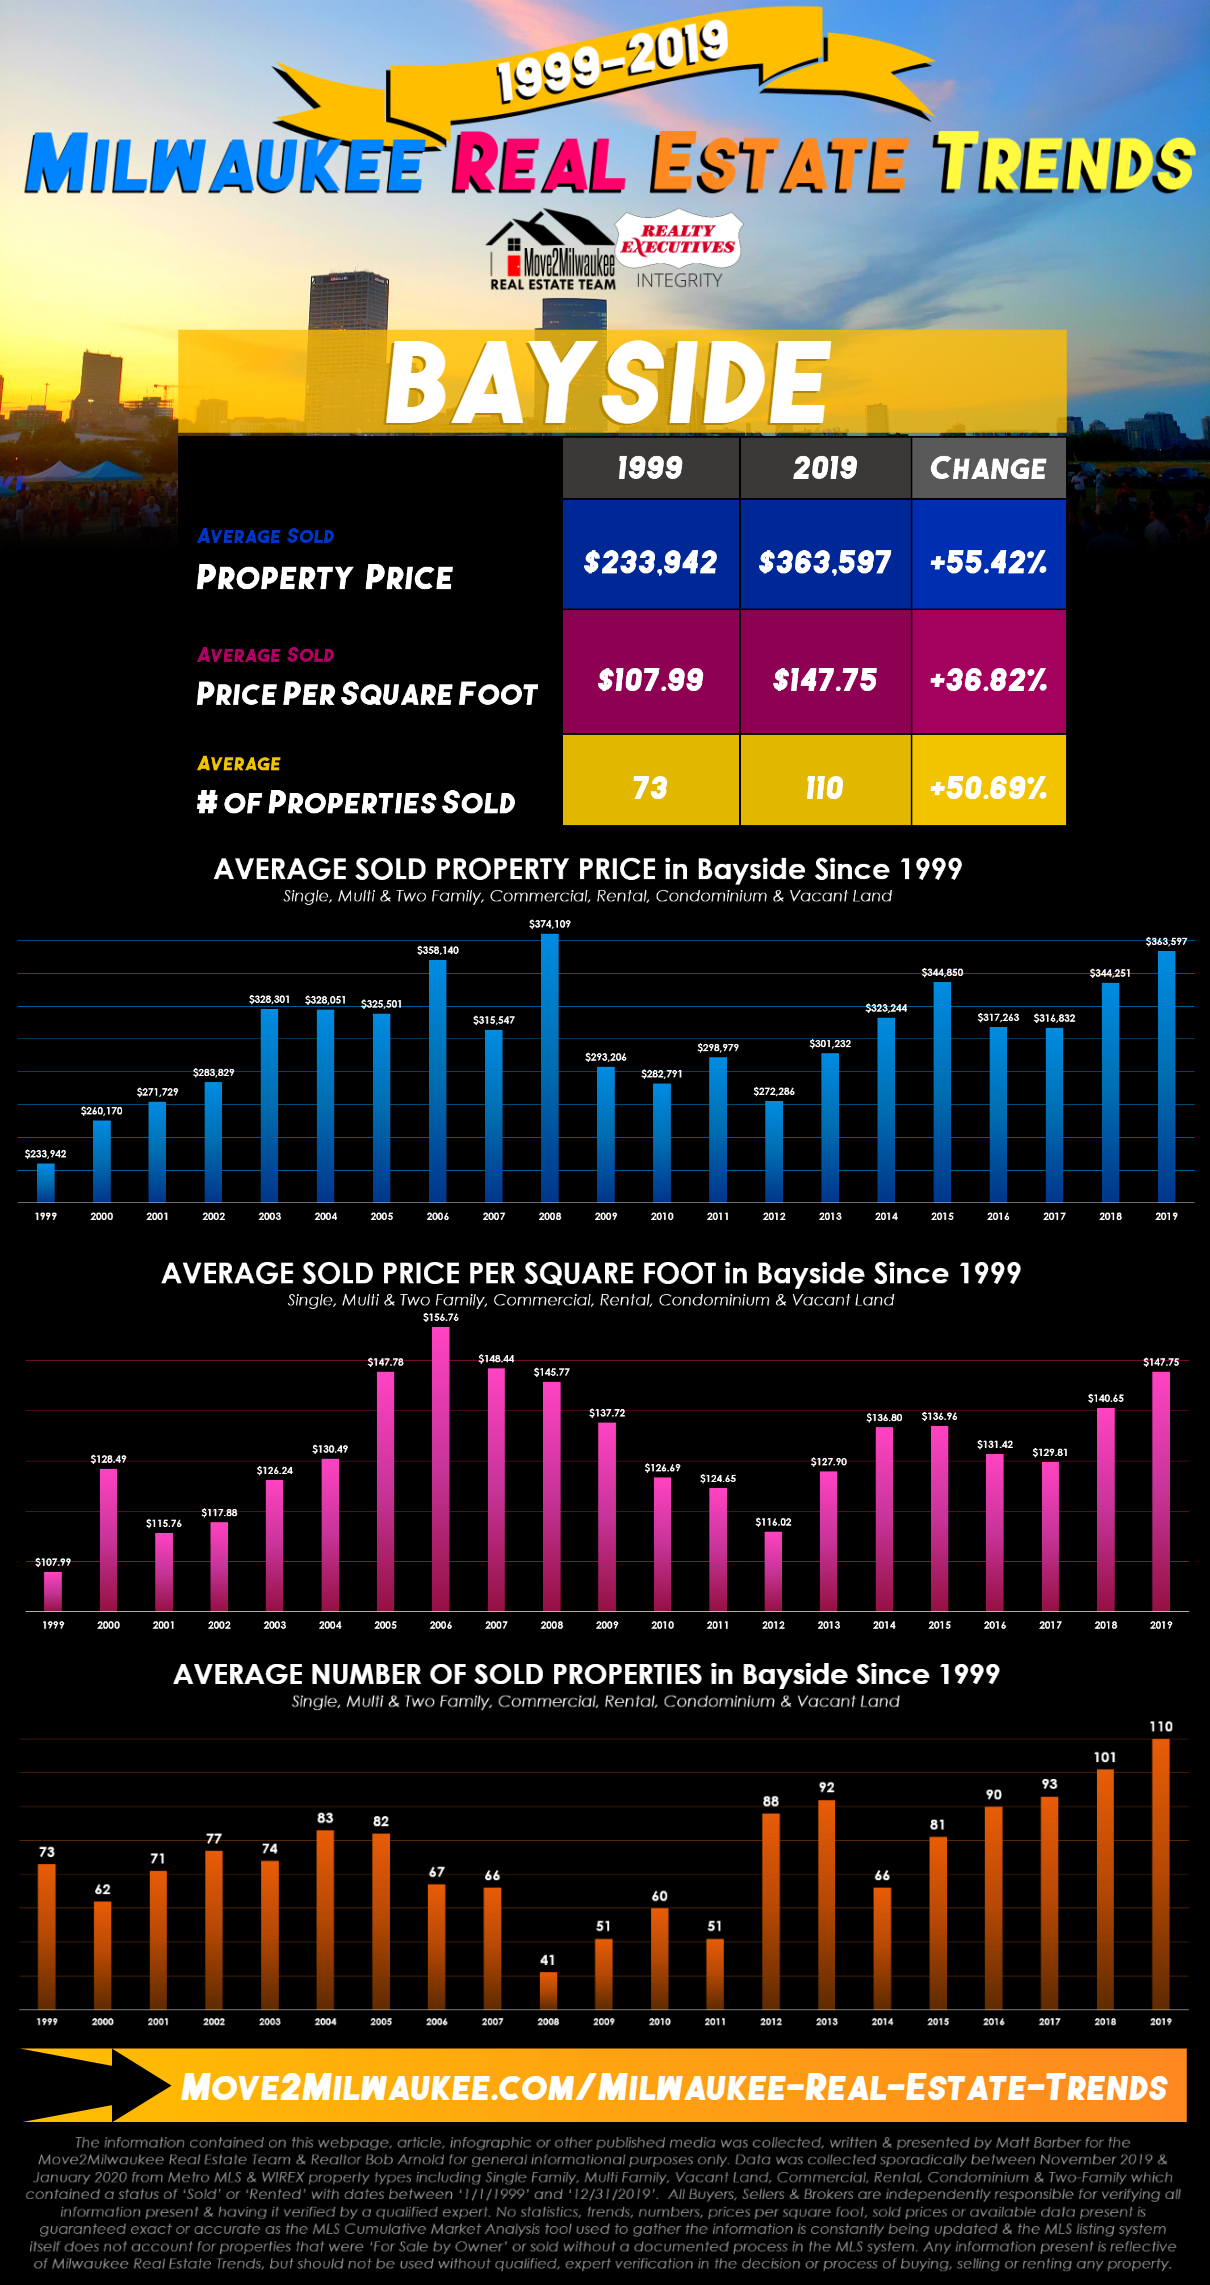
1999 to 2019 | Bayside Real Estate Statistics
Sold Single Family, Multi Family, Two Family, Vacant Land, Rental & Condominium Listings
| Bayside Statistics | # of Sold Properties | Average Sold Property Price | Average Sold Price Per Square Foot |
|---|---|---|---|
| 2019 | 110 | $363,597 | $147.75 |
| 2018 | 101 | $344,251 | $140.65 |
| 2017 | 93 | $316,832 | $129.81 |
| 2016 | 90 | $317,263 | $131.42 |
| 2015 | 81 | $344,850 | $136.96 |
| 2014 | 66 | $323,244 | $136.80 |
| 2013 | 92 | $301,232 | $127.90 |
| 2012 | 88 | $272,286 | $116.02 |
| 2011 | 51 | $298,979 | $124.65 |
| 2010 | 60 | $282,791 | $126.69 |
| 2009 | 51 | $293,206 | $137.72 |
| 2008 | 41 | $374,109 | $145.77 |
| 2007 | 66 | $315,547 | $148.44 |
| 2006 | 67 | $358,140 | $156.76 |
| 2005 | 82 | $325,501 | $147.78 |
| 2004 | 83 | $328,051 | $130.49 |
| 2003 | 74 | $328,301 | $126.24 |
| 2002 | 77 | $283,829 | $117.88 |
| 2001 | 71 | $271,729 | $115.76 |
| 2000 | 62 | $260,170 | $128.49 |
| 1999 | 73 | $233,942 | $107.99 |
BAYSIDE REAL ESTATE
Brown Deer Real Estate Statistics
Everything on Brown Deer, Wisconsin Real Estate Trends & Statistics from 1999 to 2019
With the average home having an estimated 1,529 of livable square feet, Brown Deer, Wisconsin is one of Milwaukee County’s most affordable & stable municipalities. With an only 34.52% increase in the average sold price per square foot in 2019 from 199, it had the second lowest cost per square foot change of municipalities since 1999.
Trendy neighborhoods like Bay View in Milwaukee are one of the reasons municipalities like Brown Deer remain steady. Everyone’s attention may be on another area of the county, but Brown Deer has just as much to offer as some of Milwaukee County’s most popular municipalities such as suburban neighborhoods, easy access to food, shopping, the Ozaukee County Interurban Trail & the Milwaukee River.
Population | 11,999
Zip Codes | 53209, 53223
Main Attraction | Larry’s Market
Median Household Income | $61,225
Average Home Square Footage (1999-2019) | 1,529 Est. Sq. Ft.
Borders Lake Michigan | No

1999 to 2019 | Brown Deer Real Estate Statistics
Sold Single Family, Multi Family, Two Family, Vacant Land, Rental & Condominium Listings
| Brown Deer Statistics | # of Sold Properties | Average Sold Property Price | Average Sold Price Per Square Foot |
|---|---|---|---|
| 2019 | 230 | $166,982 | $106.20 |
| 2018 | 227 | $161,780 | $100.74 |
| 2017 | 244 | $145,332 | $94.12 |
| 2016 | 213 | $132,398 | $87.04 |
| 2015 | 176 | $127,035 | $82.95 |
| 2014 | 175 | $113,887 | $77.46 |
| 2013 | 173 | $111,365 | $77.19 |
| 2012 | 151 | $100,947 | $70.53 |
| 2011 | 130 | $111,526 | $76.89 |
| 2010 | 110 | $142,293 | $93.48 |
| 2009 | 130 | $139,045 | $98.12 |
| 2008 | 139 | $151,751 | $109.40 |
| 2007 | 167 | $145,206 | $111.32 |
| 2006 | 205 | $158,013 | $110.52 |
| 2005 | 240 | $153,024 | $114.65 |
| 2004 | 225 | $142,579 | $107.72 |
| 2003 | 224 | $132,155 | $102.79 |
| 2002 | 223 | $129,117 | $92.17 |
| 2001 | 191 | $113,388 | $88.89 |
| 2000 | 218 | $107,071 | $84.81 |
| 1999 | 210 | $108,333 | $78.95 |
BROWN DEER REAL ESTATE
Bay View Real Estate Statistics
Real Estate Trends & Statistics for Bay View Spanning All the Way from 1999 to 2019
With the average home having an estimated 1,415 of livable square feet, Bay View is THE talk of the town with it being one of the most newly developed & trendiest neighborhoods in the whole County. In all of Milwaukee County, it has had the highest increase in average sold prices & average sold price per square feet in 2019 from 1999.
The Bay View of 1999 and even 2010 was vastly different than the neighborhood found today. Many recent developments including a booming foodie scene with restaurants like Goodkind, Cafe Centraal & Honeypie have contributed to the increase in this neighborhood’s base value & popularity.
Population | 20,823
Zip Codes | 53207
Main Attraction | At Random Cocktail Lounge
Median Household Income | $54,167
Average Home Square Footage (1999-2019) | 1,415 Est. Sq. Ft.
Borders Lake Michigan | YES
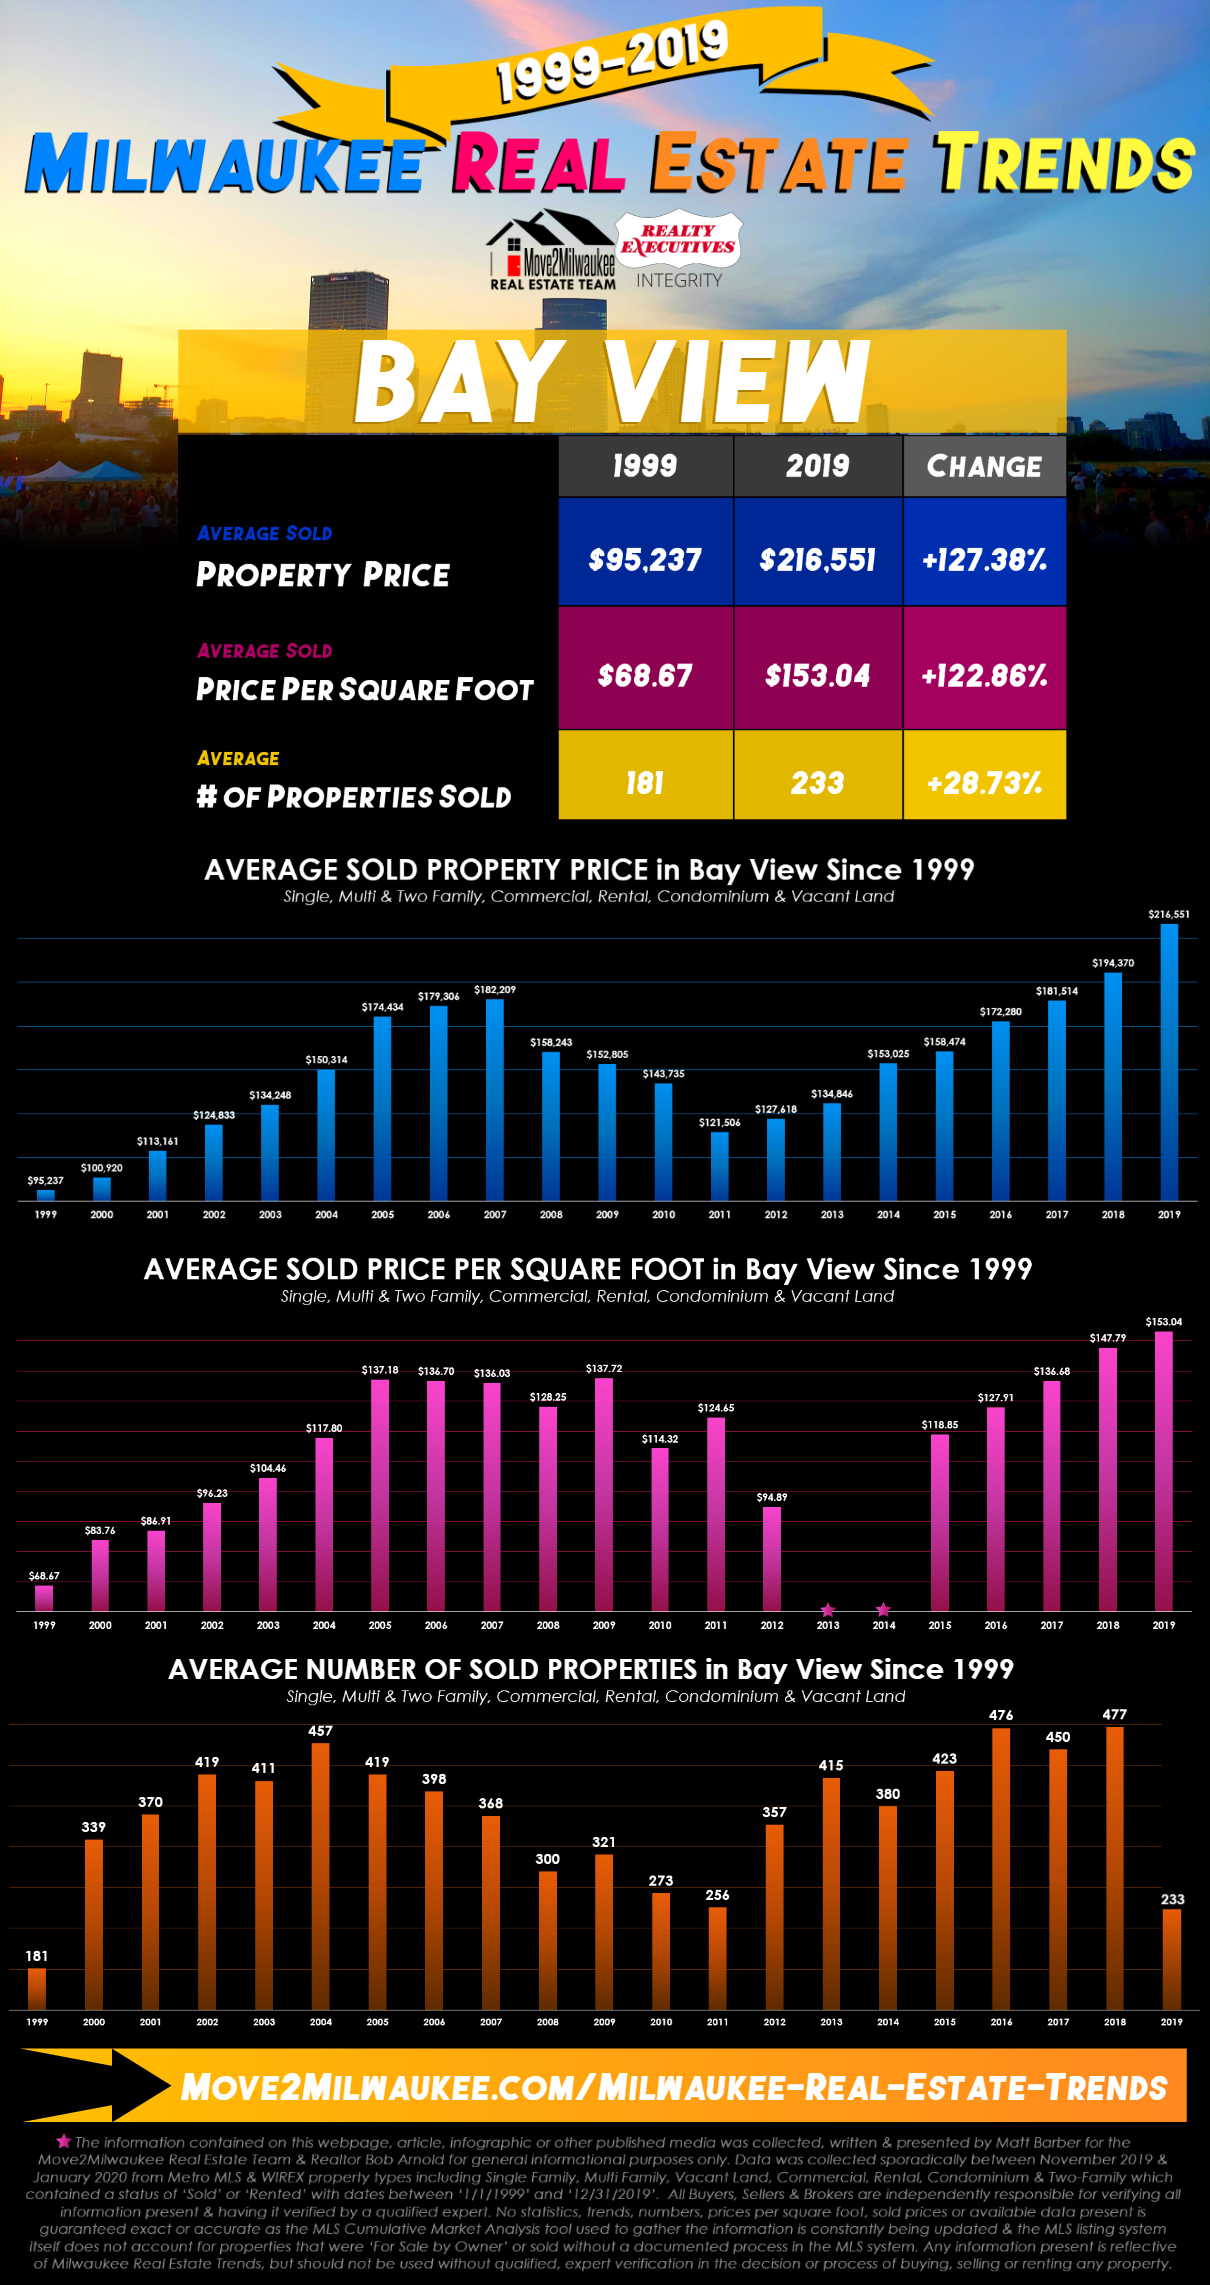
1999 to 2019 | Bay View Real Estate Statistics
Sold Single Family, Multi Family, Two Family, Vacant Land, Rental & Condominium Listings
| Bay View Statistics | # of Sold Properties | Average Sold Property Price | Average Sold Price Per Square Foot |
|---|---|---|---|
| 2019 | 233 | $216,551 | $153.04 |
| 2018 | 477 | $194,370 | $147.79 |
| 2017 | 450 | $181,514 | $136.68 |
| 2016 | 476 | $172,280 | $127.91 |
| 2015 | 423 | $158,474 | $118.85 |
| 2014 | 380 | $153,025 | N/A* |
| 2013 | 415 | $134,846 | N/A* |
| 2012 | 357 | $127,618 | $94.89 |
| 2011 | 256 | $121,506 | $93.07 |
| 2010 | 273 | $143,735 | $106.72 |
| 2009 | 321 | $152,805 | $114.32 |
| 2008 | 300 | $158,243 | $128.25 |
| 2007 | 368 | $182,209 | $136.03 |
| 2006 | 398 | $179,306 | $136.70 |
| 2005 | 419 | $174,434 | $137.18 |
| 2004 | 457 | $150,314 | $117.80 |
| 2003 | 411 | $134,248 | $104.46 |
| 2002 | 419 | $124,833 | $96.23 |
| 2001 | 370 | $113,161 | $86.91 |
| 2000 | 339 | $100,920 | $83.76 |
| 1999 | 181 | $95,237 | $68.67 |
BAY VIEW REAL ESTATE
Cudahy Real Estate Statistics
From 1999 to 2019: Everything Covered on Cudahy, Wisconsin Real Estate Trends & Statistics!
With the average home having an estimated 1,417 of livable square feet, Cudahy, Wisconsin is often overlooked in Milwaukee County because of the specific niche it has filled in the last 2 decades. From 1999 to 2020, Cudahy has not seen the same development of its neighboring municipalities & neighborhoods like St. Francis & Bay View. What gives?
Just looking at Cudahy real estate trends & statistics, you can still see a notable jump in property price from 1999 to 2019. Just south of the trendy Bay View neighborhood, its only a matter of time before development hits Cudahy as well. With its large home lots & fantastic parks, investors should keep an eye on this underdog municipality.
Population | 18,267
Zip Codes | 53110
Main Attraction | Patrick Cudahy
Median Household Income | $50,923
Average Home Square Footage (1999-2019) | 1,417 Est. Sq. Ft.
Borders Lake Michigan | YES

1999 to 2019 | Cudahy Real Estate Statistics
Sold Single Family, Multi Family, Two Family, Vacant Land, Rental & Condominium Listings
| Cudahy Statistics | # of Sold Properties | Average Sold Property Price | Average Sold Price Per Square Foot |
|---|---|---|---|
| 2019 | 306 | $167,137 | $116.65 |
| 2018 | 263 | $147,010 | $107.25 |
| 2017 | 319 | $136,315 | $101.48 |
| 2016 | 312 | $128,803 | $95.18 |
| 2015 | 256 | $115,043 | $88.73 |
| 2014 | 216 | $109,884 | $84.71 |
| 2013 | 193 | $111,420 | $79.86 |
| 2012 | 175 | $109,088 | $81.82 |
| 2011 | 155 | $100,119 | $83.74 |
| 2010 | 160 | $127,348 | $101.98 |
| 2009 | 168 | $130,556 | $106.44 |
| 2008 | 167 | $143,065 | $105.62 |
| 2007 | 208 | $172,288 | $128.95 |
| 2006 | 269 | $162,990 | $131.39 |
| 2005 | 266 | $160,615 | $121.87 |
| 2004 | 231 | $143,708 | $106.12 |
| 2003 | 231 | $130,784 | $102.42 |
| 2002 | 209 | $120,367 | $95.84 |
| 2001 | 224 | $111,275 | $86.99 |
| 2000 | 223 | $108,452 | $85.07 |
| 1999 | 258 | $104,361 | $81.07 |
CUDAHY REAL ESTATE
Fox Point Real Estate Statistics
2 Decades’ of Collected Real Estate Trends, Data & Statistics for Fox Point, Wisconsin
With the average home having an estimated 2,387 of livable square feet, Fox Point, Wisconsin has the third largest average property size coming third only to the Bayside & River Hills Municipalities. It lays right next to Lake Michigan & is just south of Ozaukee County & the Schlitz Audubon Nature Center.
While not as trendy as a neighborhood like Bay View, Fox Point is still well known in Milwaukee County. School District Report Cards show Fox Point Schools often exceed expectations & reflect why so many families compete to live in this highly sought after municipality.
Population | 6,701
Zip Codes | 53217
Main Attraction | Riverpoint Village Shopping Center
Median Household Income | $118,281
Average Home Square Footage (1999-2019) | 2,387 Est. Sq. Ft.
Borders Lake Michigan | YES

1999 to 2019 | Fox Point Real Estate Statistics
Sold Single Family, Multi Family, Two Family, Vacant Land, Rental & Condominium Listings
| Fox Point Statistics | # of Sold Properties | Average Sold Property Price | Average Sold Price Per Square Foot |
|---|---|---|---|
| 2019 | 162 | $386,066 | $154.44 |
| 2018 | 134 | $467,086 | $161.23 |
| 2017 | 168 | $364,043 | $149.80 |
| 2016 | 166 | $362,079 | $141.56 |
| 2015 | 146 | $354,185 | $142.55 |
| 2014 | 140 | $393,818 | $149.49 |
| 2013 | 119 | $334,051 | $133.49 |
| 2012 | 114 | $372,278 | $134.30 |
| 2011 | 107 | $343,696 | $136.26 |
| 2010 | 81 | $393,180 | $148.69 |
| 2009 | 88 | $345,964 | $152.15 |
| 2008 | 88 | $462,304 | $171.04 |
| 2007 | 120 | $410,921 | $173.83 |
| 2006 | 125 | $395,163 | $164.35 |
| 2005 | 149 | $376,874 | $161.33 |
| 2004 | 135 | $325,354 | $150.10 |
| 2003 | 152 | $321,151 | $139.14 |
| 2002 | 138 | $287,576 | $126.72 |
| 2001 | 120 | $289,171 | $122.02 |
| 2000 | 120 | $277,350 | $107.41 |
| 1999 | 132 | $234,098 | $113.96 |
FOX POINT REAL ESTATE
Franklin Real Estate Statistics
Franklin, Wisconsin’s Real Estate Trends Between 1999 & 2019
With the average home having an estimated 1,877 of livable square feet, Franklin, Wisconsin is an increasingly popular neighborhood in Milwaukee County where homebuyers have their eyes on living. In the top 6 of price increases since 1999, it’s more than trendy.
Home to Whitnall Park, the Wehr Nature Center, the Rock Sports Complex & included in the path of the Oak Leaf Trail for hiking & cycling, Franklin, Wisconsin draws people not only as a fantastic place to live, but an exciting municipality to visit throughout the year as well.
Population | 36,295
Zip Codes | 53132, 53221
Main Attraction | Whitnall Park
Median Household Income | $74,972
Average Home Square Footage (1999-2019) | 1,877 Est. Sq. Ft.
Borders Lake Michigan | NO
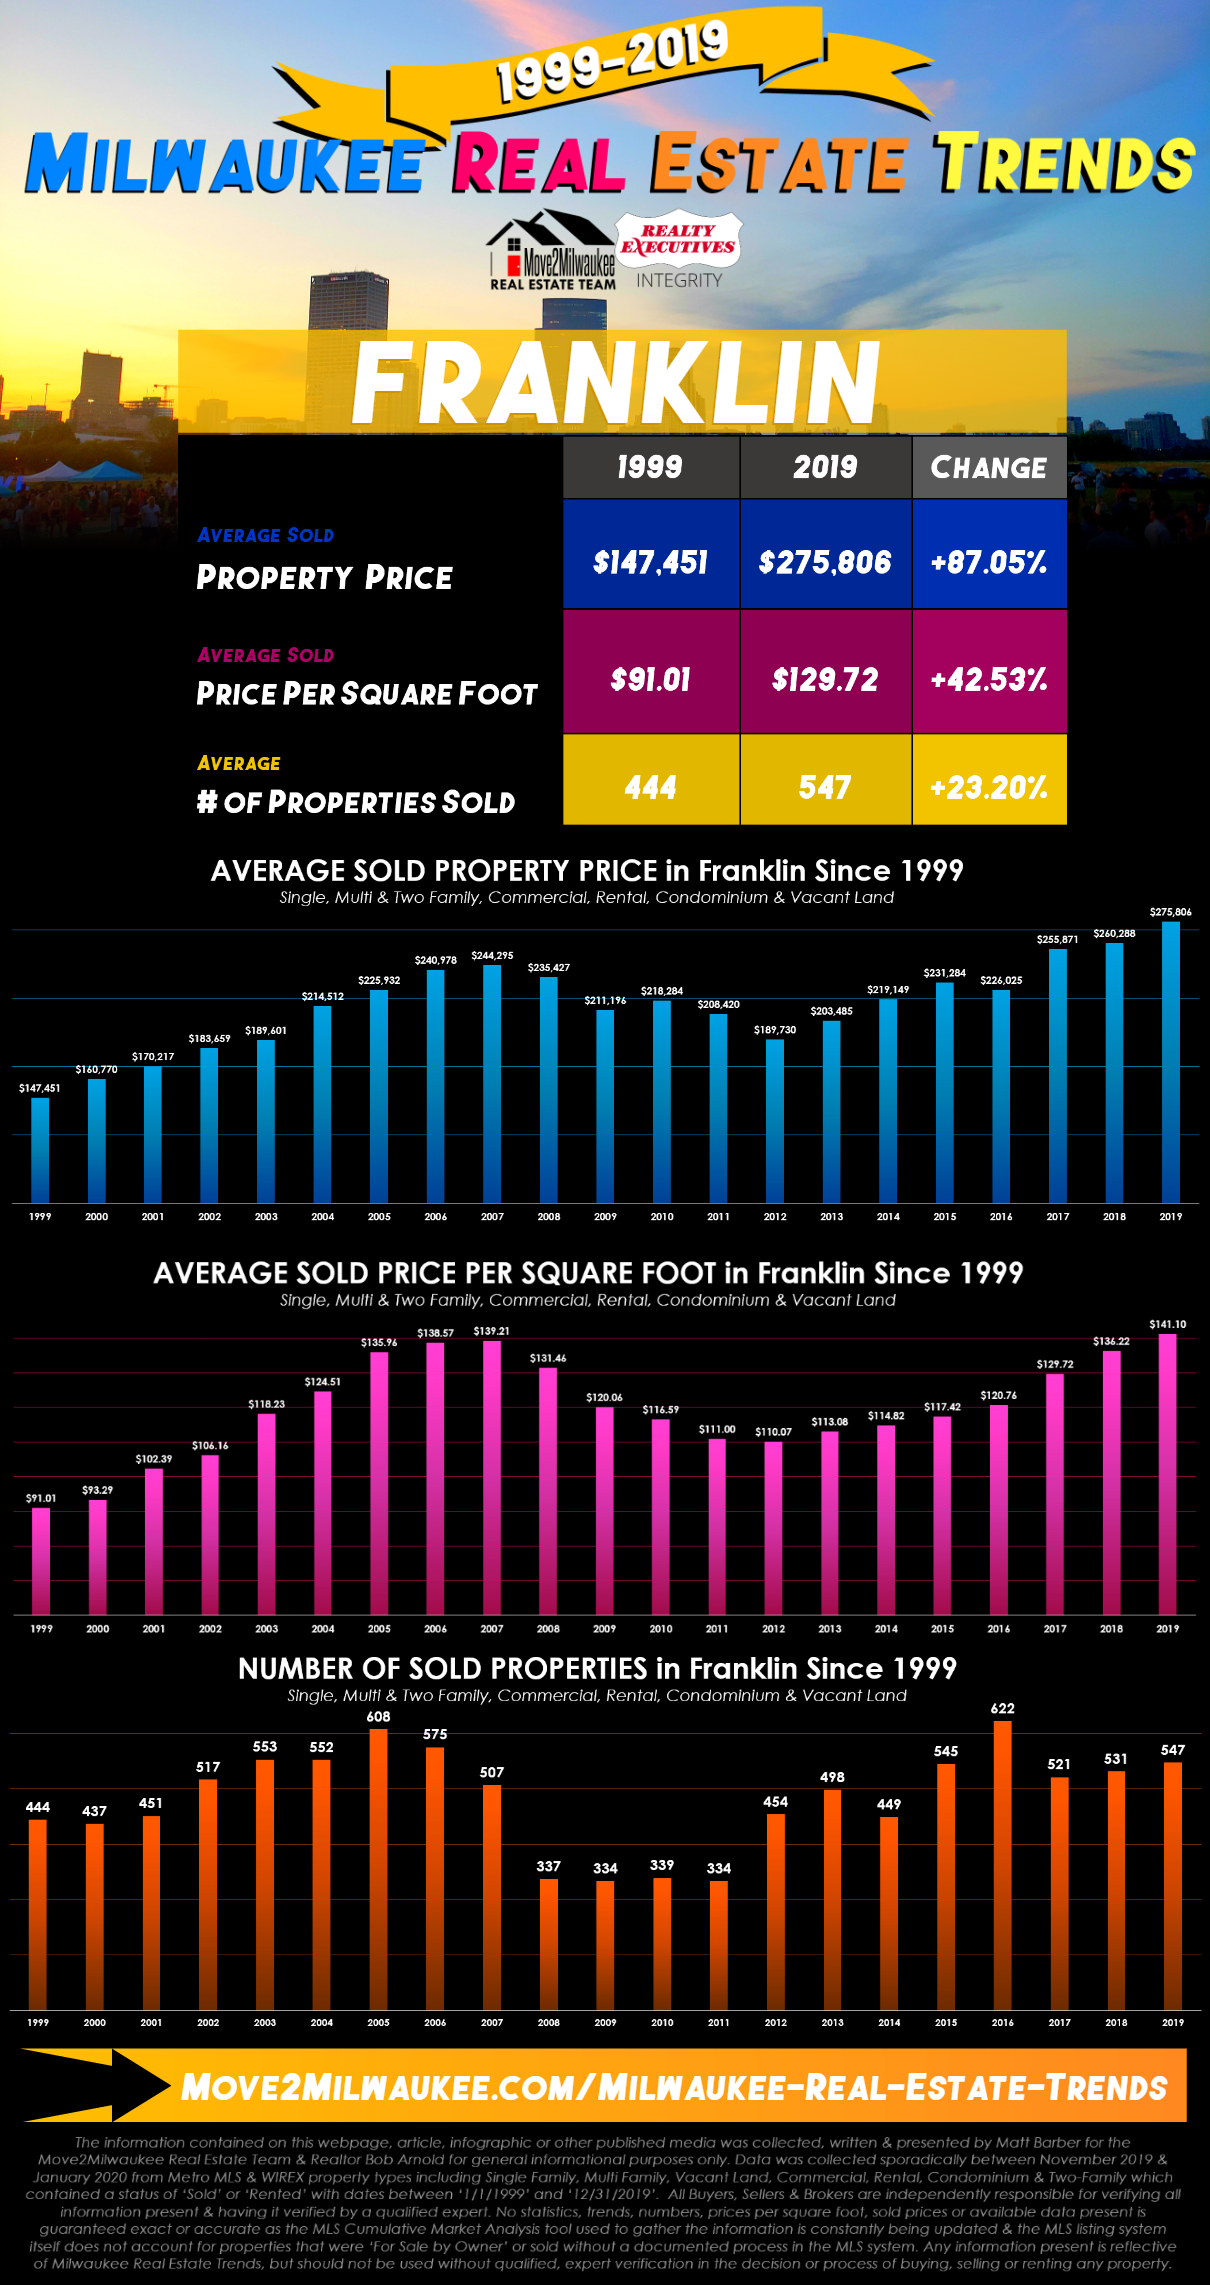
1999 to 2019 | Franklin Real Estate Statistics
Sold Single Family, Multi Family, Two Family, Vacant Land, Rental & Condominium Listings
| Franklin Statistics | # of Sold Properties | Average Sold Property Price | Average Sold Price Per Square Foot |
|---|---|---|---|
| 2019 | 547 | $275,806 | $141.10 |
| 2018 | 531 | $260,288 | $136.22 |
| 2017 | 521 | $255,871 | $129.72 |
| 2016 | 622 | $226,025 | $120.76 |
| 2015 | 545 | $231,284 | $117.42 |
| 2014 | 449 | $219,149 | $114.82 |
| 2013 | 498 | $203,485 | $113.08 |
| 2012 | 454 | $189,730 | $110.07 |
| 2011 | 334 | $208,420 | $111.00 |
| 2010 | 339 | $218,284 | $116.59 |
| 2009 | 334 | $211,196 | $120.06 |
| 2008 | 337 | $235,427 | $131.46 |
| 2007 | 507 | $244,295 | $139.21 |
| 2006 | 575 | $240,978 | $138.57 |
| 2005 | 608 | $225,932 | $135.96 |
| 2004 | 552 | $214,512 | $124.51 |
| 2003 | 553 | $189,601 | $118.23 |
| 2002 | 517 | $183,659 | $106.16 |
| 2001 | 451 | $170,217 | $102.39 |
| 2000 | 437 | $160,770 | $93.29 |
| 1999 | 444 | $147,451 | $91.01 |
FRANKLIN REAL ESTATE
Glendale Real Estate Statistics
1999-2019: 2 Decades of Glendale, Wisconsin Real Estate Trends, Statistics & Data
With the average home having an estimated 1,638 of livable square feet, Glendale, Wisconsin is one of the most consistent municipalities in Milwaukee when it comes to home sold price from 1999 to 2019 with the average home sold price only increasing 50.86%. (In comparison, the average of all municipality home sold prices increased 70.50%.)
Glendale, Wisconsin is home to the Columbia College of Nursing & a number of parks including Kletzsch Park – where Glendale’s 4th of July Fireworks are held every year, Estabrook Park, Klode Park & More.
Population | 12,872
Zip Codes | 53212, 53209, 53217
Main Attraction | Bayshore Shopping Mall
Median Household Income | $65,992
Average Home Square Footage (1999-2019) | 1,638 Est. Sq. Ft.
Borders Lake Michigan | NO

1999 to 2019 | Glendale Real Estate Statistics
Sold Single Family, Multi Family, Two Family, Vacant Land, Rental & Condominium Listings
| Glendale Statistics | # of Sold Properties | Average Sold Property Price | Average Sold Price Per Square Foot |
|---|---|---|---|
| 2019 | 295 | $215,828 | $127.31 |
| 2018 | 267 | $197,927 | $121.29 |
| 2017 | 279 | $188,649 | $116.00 |
| 2016 | 280 | $186,299 | $107.93 |
| 2015 | 235 | $171,577 | $102.63 |
| 2014 | 218 | $159,917 | $96.90 |
| 2013 | 220 | $157,061 | $95.12 |
| 2012 | 198 | $148,465 | $89.88 |
| 2011 | 136 | $159,889 | $92.33 |
| 2010 | 143 | $172,957 | $109.55 |
| 2009 | 167 | $179,101 | $122.81 |
| 2008 | 184 | $196,206 | $129.85 |
| 2007 | 220 | $192,761 | $131.81 |
| 2006 | 231 | $213,614 | $137.61 |
| 2005 | 215 | $210,764 | $129.25 |
| 2004 | 194 | $192,171 | $125.33 |
| 2003 | 197 | $178,354 | $108.17 |
| 2002 | 192 | $171,462 | $104.37 |
| 2001 | 200 | $154,422 | $97.79 |
| 2000 | 191 | $156,713 | $88.34 |
| 1999 | 201 | $143,068 | $86.49 |
GLENDALE REAL ESTATE
Greendale Real Estate Statistics
Taking a Look Back from 1999 to 2019 in Greendale Real Estate Statistics, Data & Trends!
With the average home having an estimated 1,723 of livable square feet, Greendale, Wisconsin had the second highest increase in number of sold properties of all municipalities in Milwaukee County 1999 vs 2019. It may not be making the front page like Bay View, but it’s popularity has definitely increased.
Greendale, Wisconsin is the location of Southridge Mall – one of the most popular attractions for homeowners living in Milwaukee County. You won’t find Bradford Beach or Lake Michigan anywhere nearby, but many find the suburban neighborhoods appealing when considering a place to live near those attractions.
Population | 14,046
Zip Code | 53129
Main Attraction | Southridge Mall
Median Household Income | $64,714
Average Home Square Footage (1999-2019) | 1,723 Est. Sq. Ft.
Borders Lake Michigan | NO
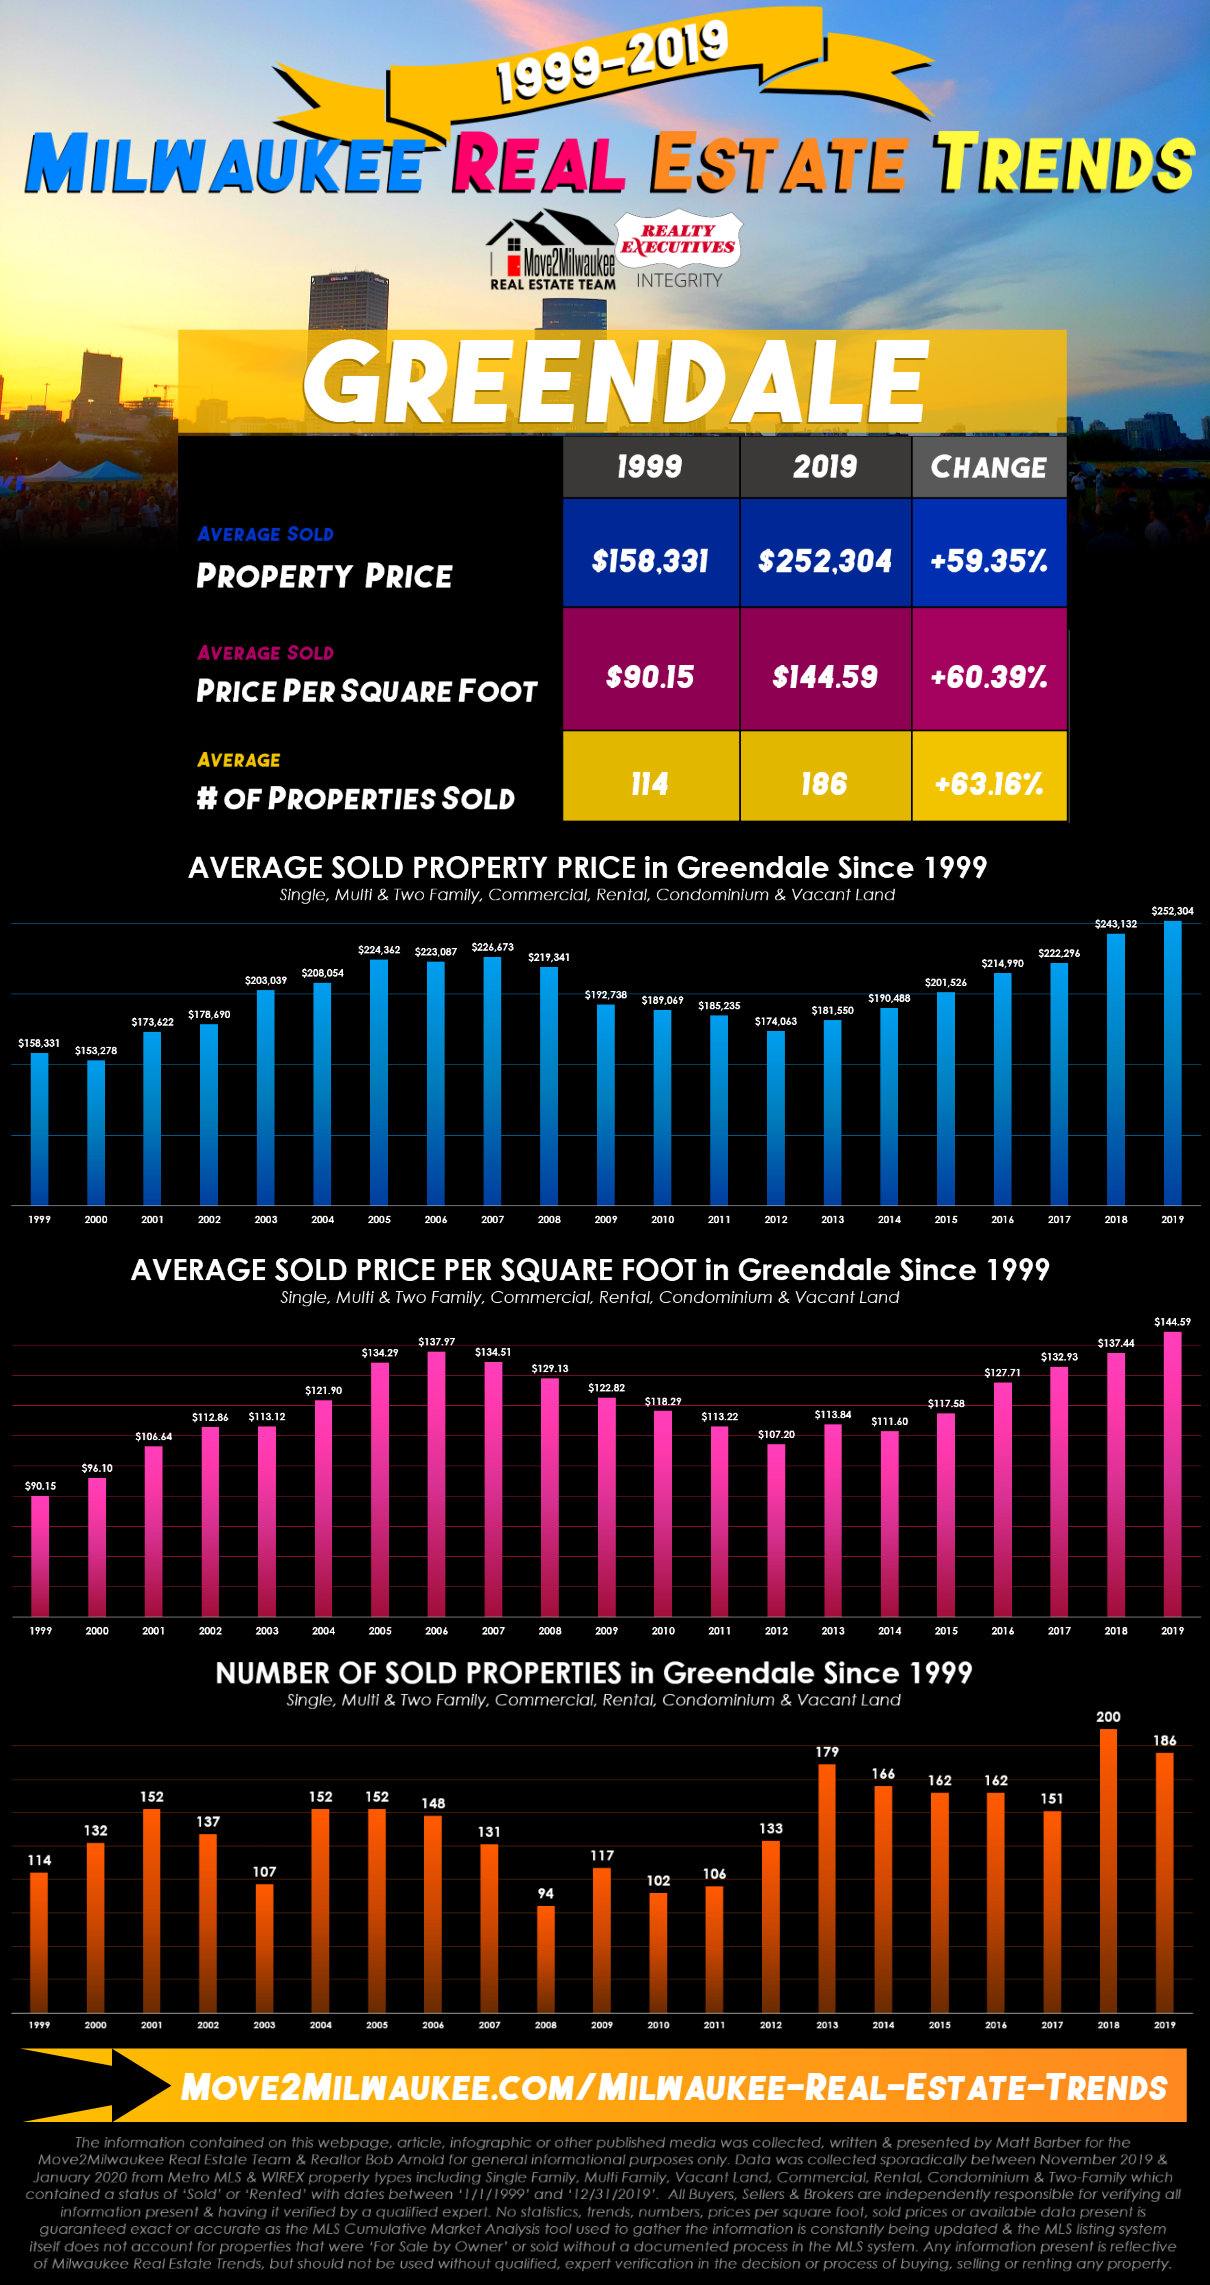
1999 to 2019 | Greendale Real Estate Statistics
Sold Single Family, Multi Family, Two Family, Vacant Land, Rental & Condominium Listings
| Greendale Statistics | # of Sold Properties | Average Sold Property Price | Average Sold Price Per Square Foot |
|---|---|---|---|
| 2019 | 186 | $252,304 | $144.59 |
| 2018 | 200 | $243,132 | $137.44 |
| 2017 | 151 | $222,296 | $132.93 |
| 2016 | 162 | $214,990 | $127.71 |
| 2015 | 162 | $201,526 | $117.58 |
| 2014 | 166 | $190,488 | $111.60 |
| 2013 | 179 | $181,550 | $113.84 |
| 2012 | 133 | $174,063 | $107.20 |
| 2011 | 106 | $185,235 | $113.22 |
| 2010 | 102 | $189,069 | $118.29 |
| 2009 | 117 | $192,738 | $122.82 |
| 2008 | 94 | $219,341 | $129.13 |
| 2007 | 131 | $226,673 | $134.51 |
| 2006 | 148 | $223,087 | $137.97 |
| 2005 | 152 | $224,362 | $134.29 |
| 2004 | 152 | $208,054 | $121.90 |
| 2003 | 107 | $203,039 | $113.12 |
| 2002 | 137 | $178,690 | $112.86 |
| 2001 | 152 | $173,622 | $106.64 |
| 2000 | 132 | $153,278 | $96.10 |
| 1999 | 114 | $158,331 | $90.15 |
GREENDALE REAL ESTATE
Greenfield Real Estate Statistics
20 Years of Comprehensive Greenfield, WI Real Estate Trends, Data & Statistics
With the average home having an estimated 1,509 of livable square feet, Greenfield, Wisconsin is a steadily rising municipality in Milwaukee County. With average home prices increasing around the average number of all municipalities in Milwaukee, Greenfield historically has been a low risk investment for anyone looking to move locally.
For families, Greenfield has some of the best options for restaurants & shopping. While you’ll have to take a short drive to visit a museum, Zoo or Lake Michigan, it’s a shorter drive for Greenfield homeowners who need groceries or a trip to the mall.
Population | 37,358
Zip Codes | 53129, 53219, 53220, 53221, 53227, 53228
Main Attraction | Oak Leaf Trail
Median Household Income | $54,973
Average Home Square Footage (1999-2019) | 1,509 Est. Sq. Ft.
Borders Lake Michigan | NO

1999 to 2019 | Greenfield Real Estate Statistics
Sold Single Family, Multi Family, Two Family, Vacant Land, Rental & Condominium Listings
| Greenfield Statistics | # of Sold Properties | Average Sold Property Price | Average Sold Price Per Square Foot |
|---|---|---|---|
| 2019 | 508 | $196,072 | $129.83 |
| 2018 | 547 | $189,018 | $122.25 |
| 2017 | 502 | $187,043 | $114.84 |
| 2016 | 483 | $163,278 | $104.85 |
| 2015 | 470 | $155,361 | $102.69 |
| 2014 | 469 | $148,082 | $95.89 |
| 2013 | 422 | $138,017 | $96.05 |
| 2012 | 347 | $135,066 | $90.58 |
| 2011 | 283 | $142,364 | $96.29 |
| 2010 | 283 | $154,810 | $103.92 |
| 2009 | 331 | $162,911 | $114.72 |
| 2008 | 330 | $177,358 | $122.33 |
| 2007 | 378 | $184,073 | $130.30 |
| 2006 | 414 | $195,682 | $131.78 |
| 2005 | 399 | $196,378 | $130.29 |
| 2004 | 439 | $172,094 | $118.45 |
| 2003 | 397 | $156,289 | $109.98 |
| 2002 | 445 | $143,525 | $101.43 |
| 2001 | 415 | $130,115 | $96.82 |
| 2000 | 423 | $120,682 | $92.59 |
| 1999 | 367 | $119,706 | $88.33 |
GREENFIELD REAL ESTATE
Hales Corners Real Estate Statistics
Discover 2 Decades’ Worth of Hales Corners Real Estate Trends, Statistics & Data with Move2Milwaukee!
With the average home having an estimated 1,730 of livable square feet, Hales Corners, Wisconsin is the second lowest municipality in Milwaukee County when it comes to number of sold properties in 1999 vs 2019. This means locals obviously love living in Hales Corners – it’s a great place to find your forever home!
Hales Corners is similar to Greenfield in the sense that you’re further from Lake Michigan, but the trade off is easier shopping. Being further out from the city too, homeowners in Hales Corners are also much closer to nature with Whitnall Park.
Population | 7,692
Zip Codes | 53130
Main Attraction | Boerner Botanical Gardens
Median Household Income | $71,516
Average Home Square Footage (1999-2019) | 1,730 Est. Sq. Ft.
Borders Lake Michigan | NO
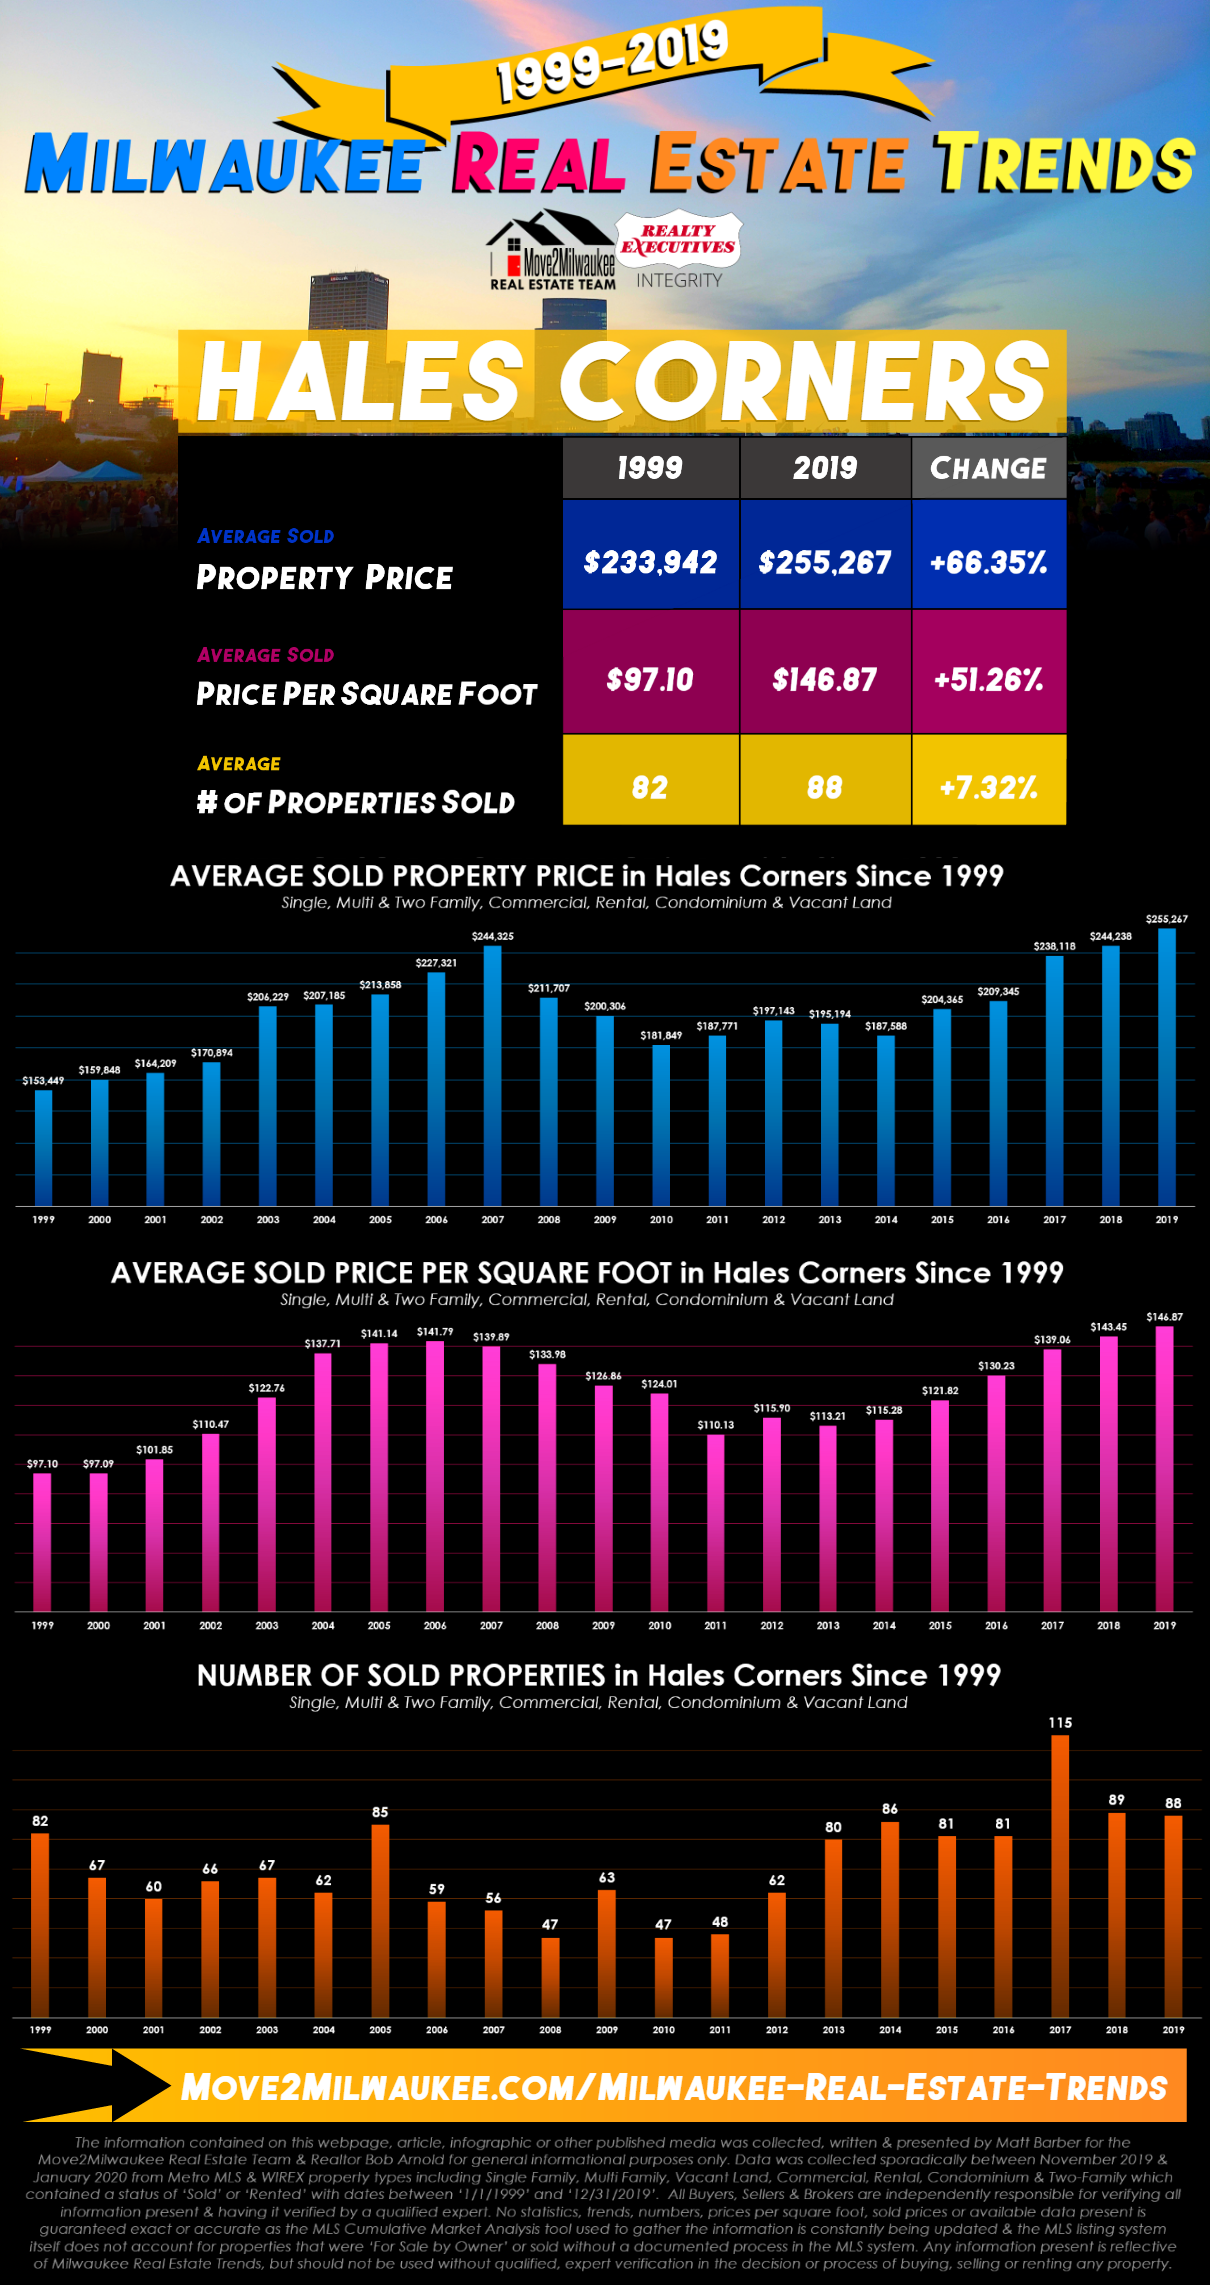
1999 to 2019 | Hales Corners Real Estate Statistics
Sold Single Family, Multi Family, Two Family, Vacant Land, Rental & Condominium Listings
| Hales Corners Statistics | # of Sold Properties | Average Sold Property Price | Average Sold Price Per Square Foot |
|---|---|---|---|
| 2019 | 88 | $255,267 | $146.87 |
| 2018 | 89 | $244,238 | $143.45 |
| 2017 | 115 | $238,118 | $139.06 |
| 2016 | 81 | $209,345 | $130.23 |
| 2015 | 81 | $204,365 | $121.82 |
| 2014 | 86 | $187,588 | $115.28 |
| 2013 | 80 | $195,194 | $113.21 |
| 2012 | 62 | $197,143 | $115.90 |
| 2011 | 48 | $187,771 | $110.13 |
| 2010 | 47 | $181,849 | $124.01 |
| 2009 | 63 | $200,306 | $126.86 |
| 2008 | 47 | $211,707 | $133.98 |
| 2007 | 56 | $244,325 | $139.89 |
| 2006 | 59 | $227,321 | $141.79 |
| 2005 | 85 | $213,858 | $141.14 |
| 2004 | 62 | $207,185 | $137.71 |
| 2003 | 67 | $206,229 | $122.76 |
| 2002 | 66 | $170,894 | $110.47 |
| 2001 | 60 | $164,209 | $101.85 |
| 2000 | 67 | $159,848 | $97.09 |
| 1999 | 82 | $153,449 | $97.10 |
HALES CORNERS REAL ESTATE
Milwaukee Real Estate Statistics
Dive Deep into 20 Years of Milwaukee Real Estate Statistics, Data & Trends with Our Team of Milwaukee Realtors
With the average home having an estimated 1,390 of livable square feet, Milwaukee, Wisconsin is different than Milwaukee County. Keep in mind this municipality is the largest of all municipalities in Milwaukee County & that the numbers in our data below only accounts for the Milwaukee municipality, which does include the Bay View neighborhood. (We did a separate break down of Bay View Real Estate Statistics above – check it out!)
The Milwaukee municipality sprawls all the way from Lake Michigan to the south side of the Mequon Nature Preserve. You’ll find everything from the Milwaukee County Zoo near Wauwatosa to the iconic Milwaukee Art Museum, Milwaukee Public Museum, the Third Ward & more on the east side.
Population | 595,351
Zip Codes | 53201, 53202, 53203, 53204, 53205, 53206, 53207, 53208, 53209, 53210, 53211, 53212, 53213, 53214, 53215, 53216, 53217, 53218, 53219, 53220, 53221, 53222, 53223, 53224, 53225, 53226, 53227, 53228, 53233, 53234, 53235, 53237, 54244, 53259, 53263, 53267, 53268, 53274, 53278, 53288, 53290, 53293, 563295
Main Attraction | Milwaukee County Zoo
Median Household Income | $42,087
Average Home Square Footage (1999-2019) | 1,390 Est. Sq. Ft.
Borders Lake Michigan | YES

1999 to 2019 | Milwaukee Real Estate Statistics
Sold Single Family, Multi Family, Two Family, Vacant Land, Rental & Condominium Listings
| Milwaukee Statistics | # of Sold Properties | Average Sold Property Price | Average Sold Price Per Square Foot |
|---|---|---|---|
| 2019 | 6,517 | $154,377 | $111.75 |
| 2018 | 6,725 | $143,490 | $170.80 |
| 2017 | 6,646 | $133,320 | $143.42 |
| 2016 | 6,281 | $123,857 | $117.70 |
| 2015 | 5,626 | $119,097 | $115.38 |
| 2014 | 5,440 | $107,611 | $184.32 |
| 2013 | 5,752 | $100,500 | $120.35 |
| 2012 | 5,494 | $90,266 | $65.09 |
| 2011 | 4,578 | $87,226 | $65.35 |
| 2010 | 4,371 | $100,962 | $78.63 |
| 2009 | 5,552 | $105,409 | $83.47 |
| 2008 | 4,850 | $135,643 | $104.57 |
| 2007 | 5,513 | $167,208 | $185.21 |
| 2006 | 7,281 | $156,056 | $149.54 |
| 2005 | 7,753 | $147,762 | $106.76 |
| 2004 | 7,605 | $128,211 | $98.98 |
| 2003 | 7,035 | $116,448 | $85.36 |
| 2002 | 6,322 | $104,666 | $78.57 |
| 2001 | 5,673 | $97,245 | $70.24 |
| 2000 | 5,402 | $88,487 | $73.76 |
| 1999 | 5,277 | $85,007 | $62.86 |
MILWAUKEE REAL ESTATE
Oak Creek Real Estate Statistics
Breaking Down Oak Creek Real Estate Trends & Statistics from 1999 to 2019
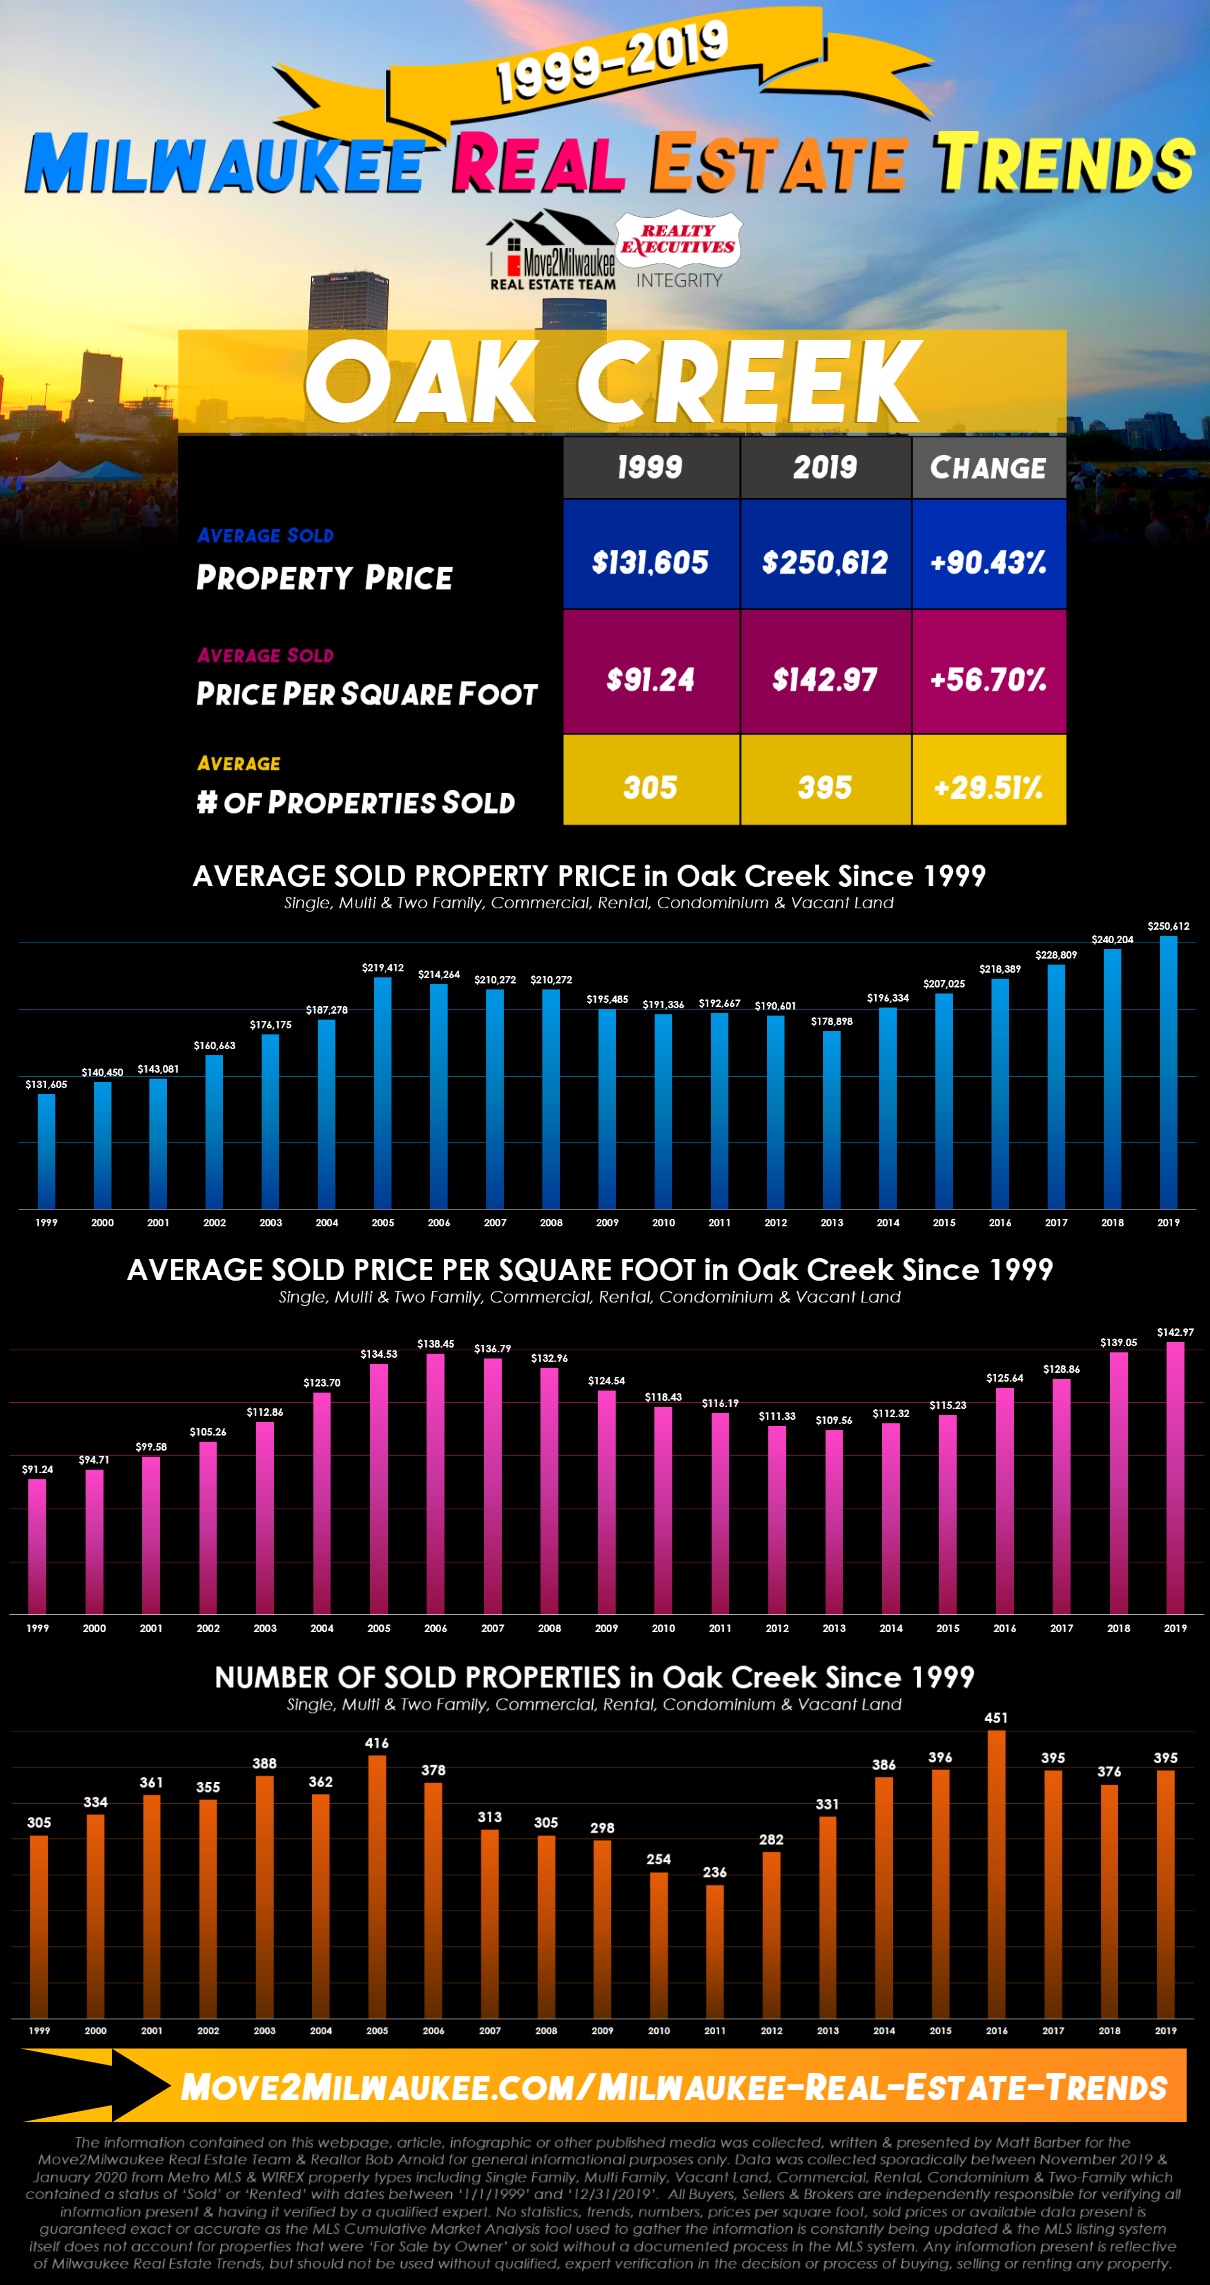
With the average home having an estimated 1,694 of livable square feet, Oak Creek, Wisconsin is the 5th highest municipality in Milwaukee County when it comes to the increase in average sold prices in 1999 vs 2019. With a 90.43% Increase in average sold home prices ($131,605 in 1999 to $250,612 in 2019), Oak Creek has seen a large increase in property price, mostly due to local development.
One of the biggest changes Oak Creek saw was the development of Drexel Town Square. Not only were new condominiums & a town hall built, but along with it came a handful of new restaurants, stores & hotels where an empty warehouse once was. Not only is Oak Creek close to downtown Milwaukee, but homeowners in this municipality don’t have to drive far to get the things they need.
Population | 36,470
Zip Codes | 53154
Main Attraction | Drexel Town Square
Median Household Income | $70,530
Average Home Square Footage (1999-2019) | 1,694 Est. Sq. Ft.
Borders Lake Michigan | YES
1999 to 2019 | Oak Creek Real Estate Statistics
Sold Single Family, Multi Family, Two Family, Vacant Land, Rental & Condominium Listings
| Oak Creek Statistics | # of Sold Properties | Average Sold Property Price | Average Sold Price Per Square Foot |
|---|---|---|---|
| 2019 | 395 | $250,612 | $142.97 |
| 2018 | 376 | $240,204 | $139.05 |
| 2017 | 395 | $228,809 | $128.86 |
| 2016 | 451 | $218,389 | $125.64 |
| 2015 | 396 | $207,025 | $115.23 |
| 2014 | 386 | $196,334 | $112.32 |
| 2013 | 331 | $178,898 | $109.56 |
| 2012 | 282 | $190,601 | $111.33 |
| 2011 | 236 | $192,667 | $116.19 |
| 2010 | 254 | $191,336 | $118.43 |
| 2009 | 298 | $195,485 | $124.54 |
| 2008 | 305 | $210,272 | $132.96 |
| 2007 | 313 | $211,570 | $136.79 |
| 2006 | 378 | $214,264 | $138.45 |
| 2005 | 416 | $219,412 | $134.53 |
| 2004 | 362 | $187,278 | $123.70 |
| 2003 | 388 | $176,175 | $112.86 |
| 2002 | 355 | $160,663 | $105.26 |
| 2001 | 361 | $143,081 | $99.58 |
| 2000 | 334 | $140,450 | $94.71 |
| 1999 | 305 | $131,605 | $91.24 |
OAK CREEK REAL ESTATE
River Hills Real Estate Statistics
Trek Through Rivers Hills, WI Real Estate Trends, Data & Statistics from 2 Decades: 1999 to 2019!
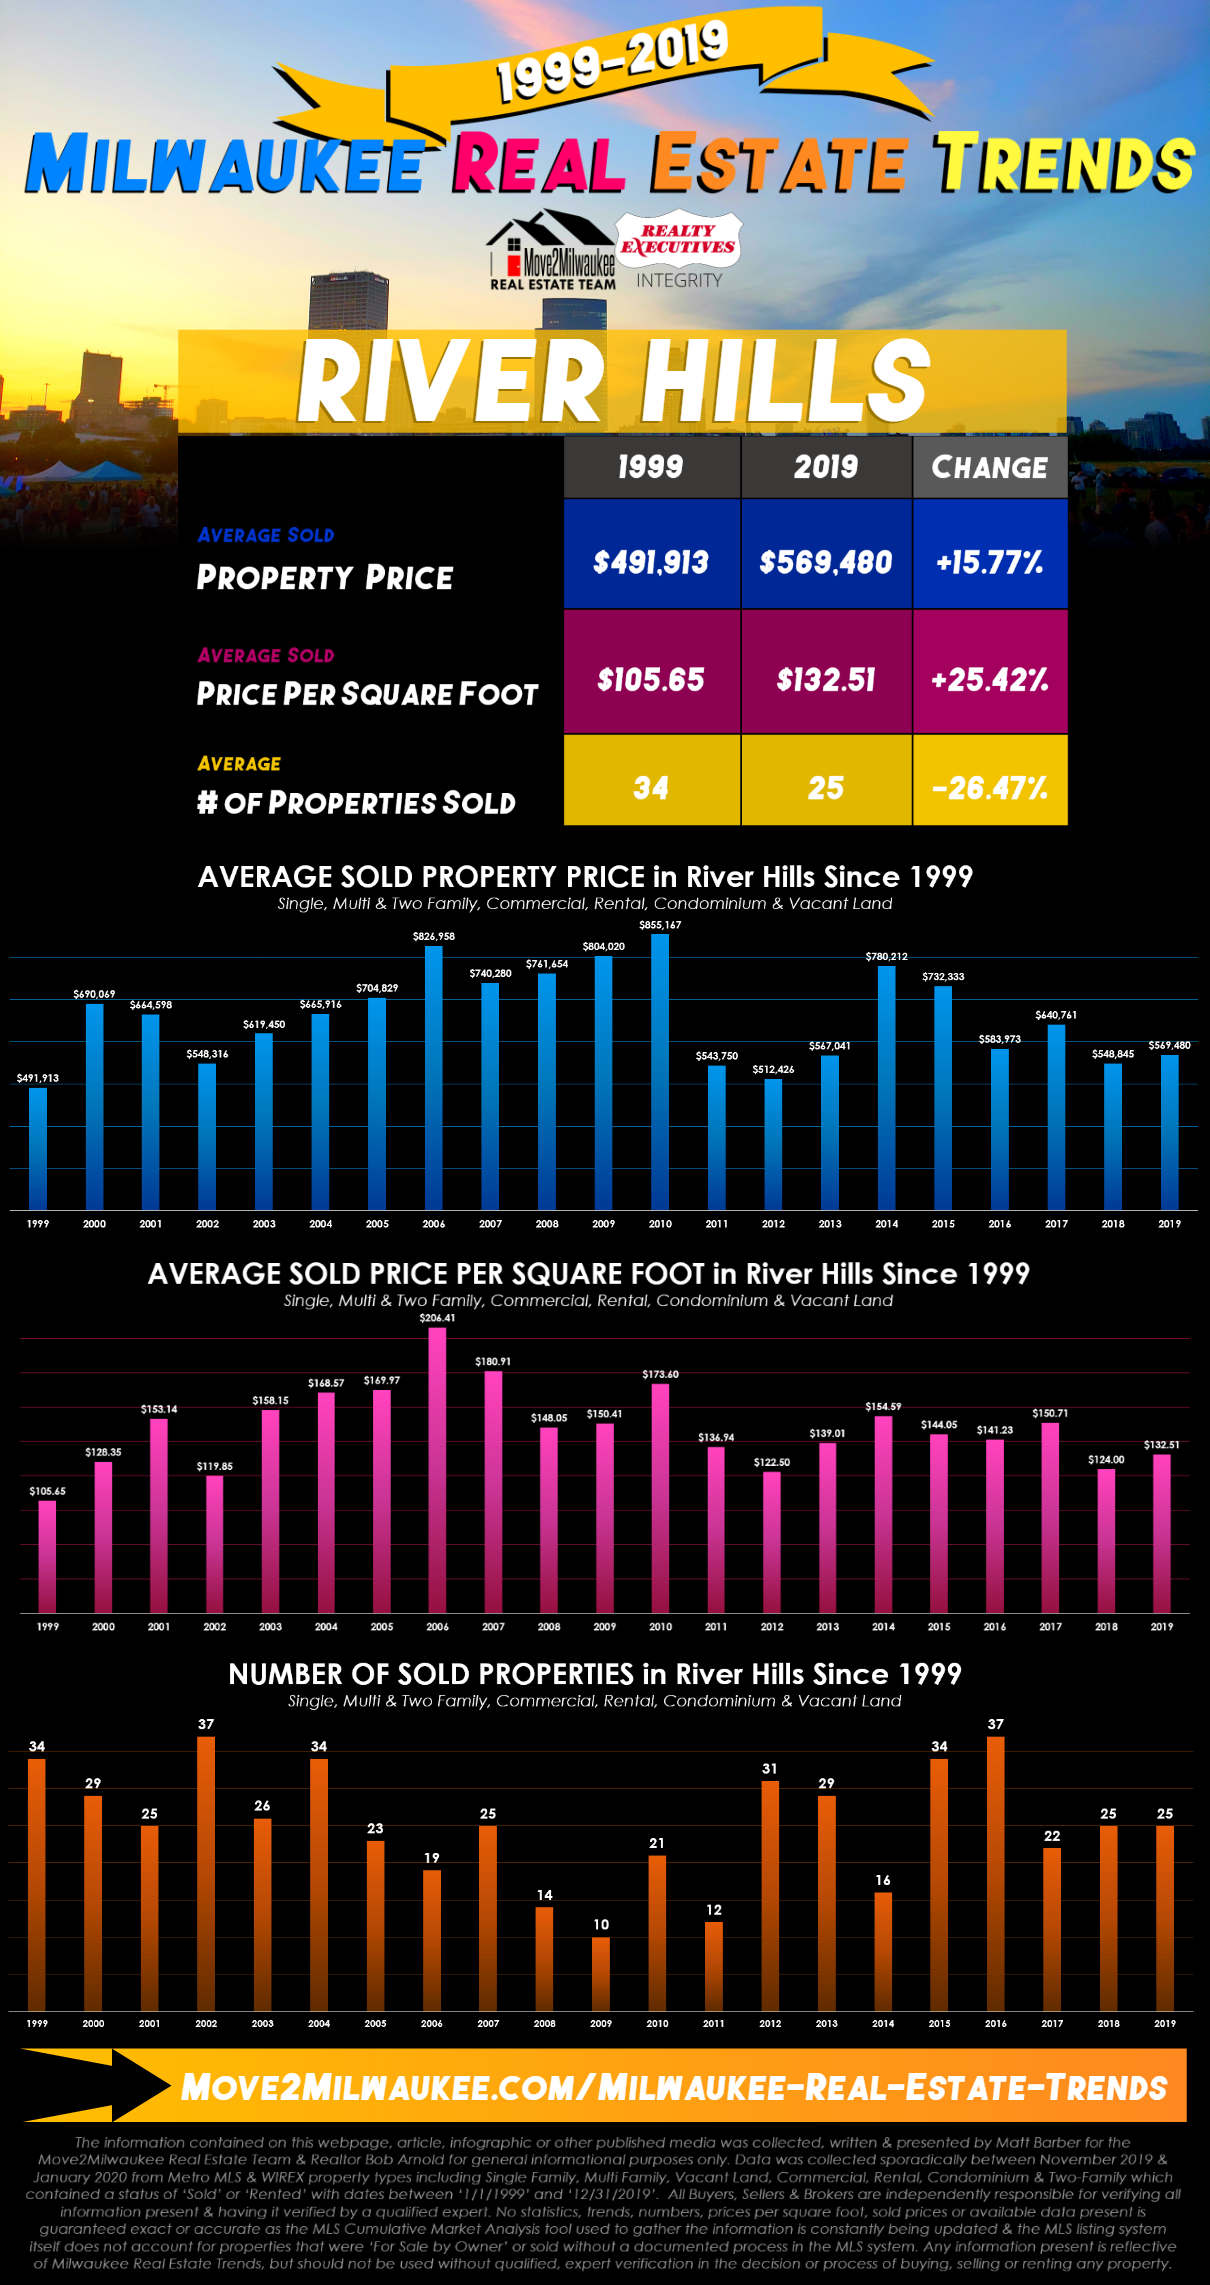
With the average home having an estimated 4,354 of livable square feet, River Hills, Wisconsin has the largest homes per square foot in Milwaukee County. As a result, price per square foot tends to remain consistent. River Hills has the lowest increase in sold price per square foot in all of Milwaukee County when comparing 1999 & 2019. (That’s a mere 25.42% increase! In comparison, Bay View has had a 122.86% increase in sold price per square foot.)
Numbers aside, River Hills isn’t only a great place to live, it’s also a fantastic destination. If you’re in Milwaukee County & the sun’s out, you may want to stop by the Lynden Sculpture Garden or the Milwaukee Country Club. River Hills is also home to a Preparatory school known as the University School of Milwaukee.
*River Hills is the only municipality in Milwaukee County to see a decrease in any of it’s data when comparing 1999 to 2019. When looking at the number of sold properties, River Hills sold less properties in 2019 than it did in 1999. There are always a number of factors that could lead to this unique statistic. If you have any questions regarding this change, please contact Realtor Bob Arnold directly at 414-379-1101!
Population | 1,597
Zip Codes | 53217
Main Attraction | Lynden Sculpture Garden
Median Household Income | $156,944
Average Home Square Footage (1999-2019) | 4,354 Est. Sq. Ft.
Borders Lake Michigan | NO
1999 to 2019 | River Hills Real Estate Statistics
Sold Single Family, Multi Family, Two Family, Vacant Land, Rental & Condominium Listings
| River Hills Statistics | # of Sold Properties | Average Sold Property Price | Average Sold Price Per Square Foot |
|---|---|---|---|
| 2019 | 25 | $569,480 | $132.51 |
| 2018 | 25 | $548,845 | $124.00 |
| 2017 | 22 | $640,761 | $150.71 |
| 2016 | 37 | $583,973 | $141.23 |
| 2015 | 34 | $732,333 | $144.05 |
| 2014 | 16 | $780,212 | $154.59 |
| 2013 | 29 | $567,041 | $139.01 |
| 2012 | 31 | $512,426 | $122.50 |
| 2011 | 12 | $543,750 | $136.94 |
| 2010 | 21 | $855,167 | $173.60 |
| 2009 | 10 | $804,020 | $150.41 |
| 2008 | 14 | $761,654 | $148.05 |
| 2007 | 25 | $740,280 | $180.91 |
| 2006 | 19 | $826,958 | $206.41 |
| 2005 | 23 | $704,829 | $169.97 |
| 2004 | 34 | $665,916 | $168.57 |
| 2003 | 26 | $619,450 | $158.15 |
| 2002 | 37 | $548,316 | $119.85 |
| 2001 | 25 | $664,598 | $153.14 |
| 2000 | 29 | $690,069 | $128.35 |
| 1999 | 34 | $491,913 | $105.65 |
RIVER HILLS REAL ESTATE
Shorewood Real Estate Statistics
Uncovering 20 Years of Shorewood, Wisconsin Real Estate Trends, Statistics & Data with the Move2Milwaukee Team
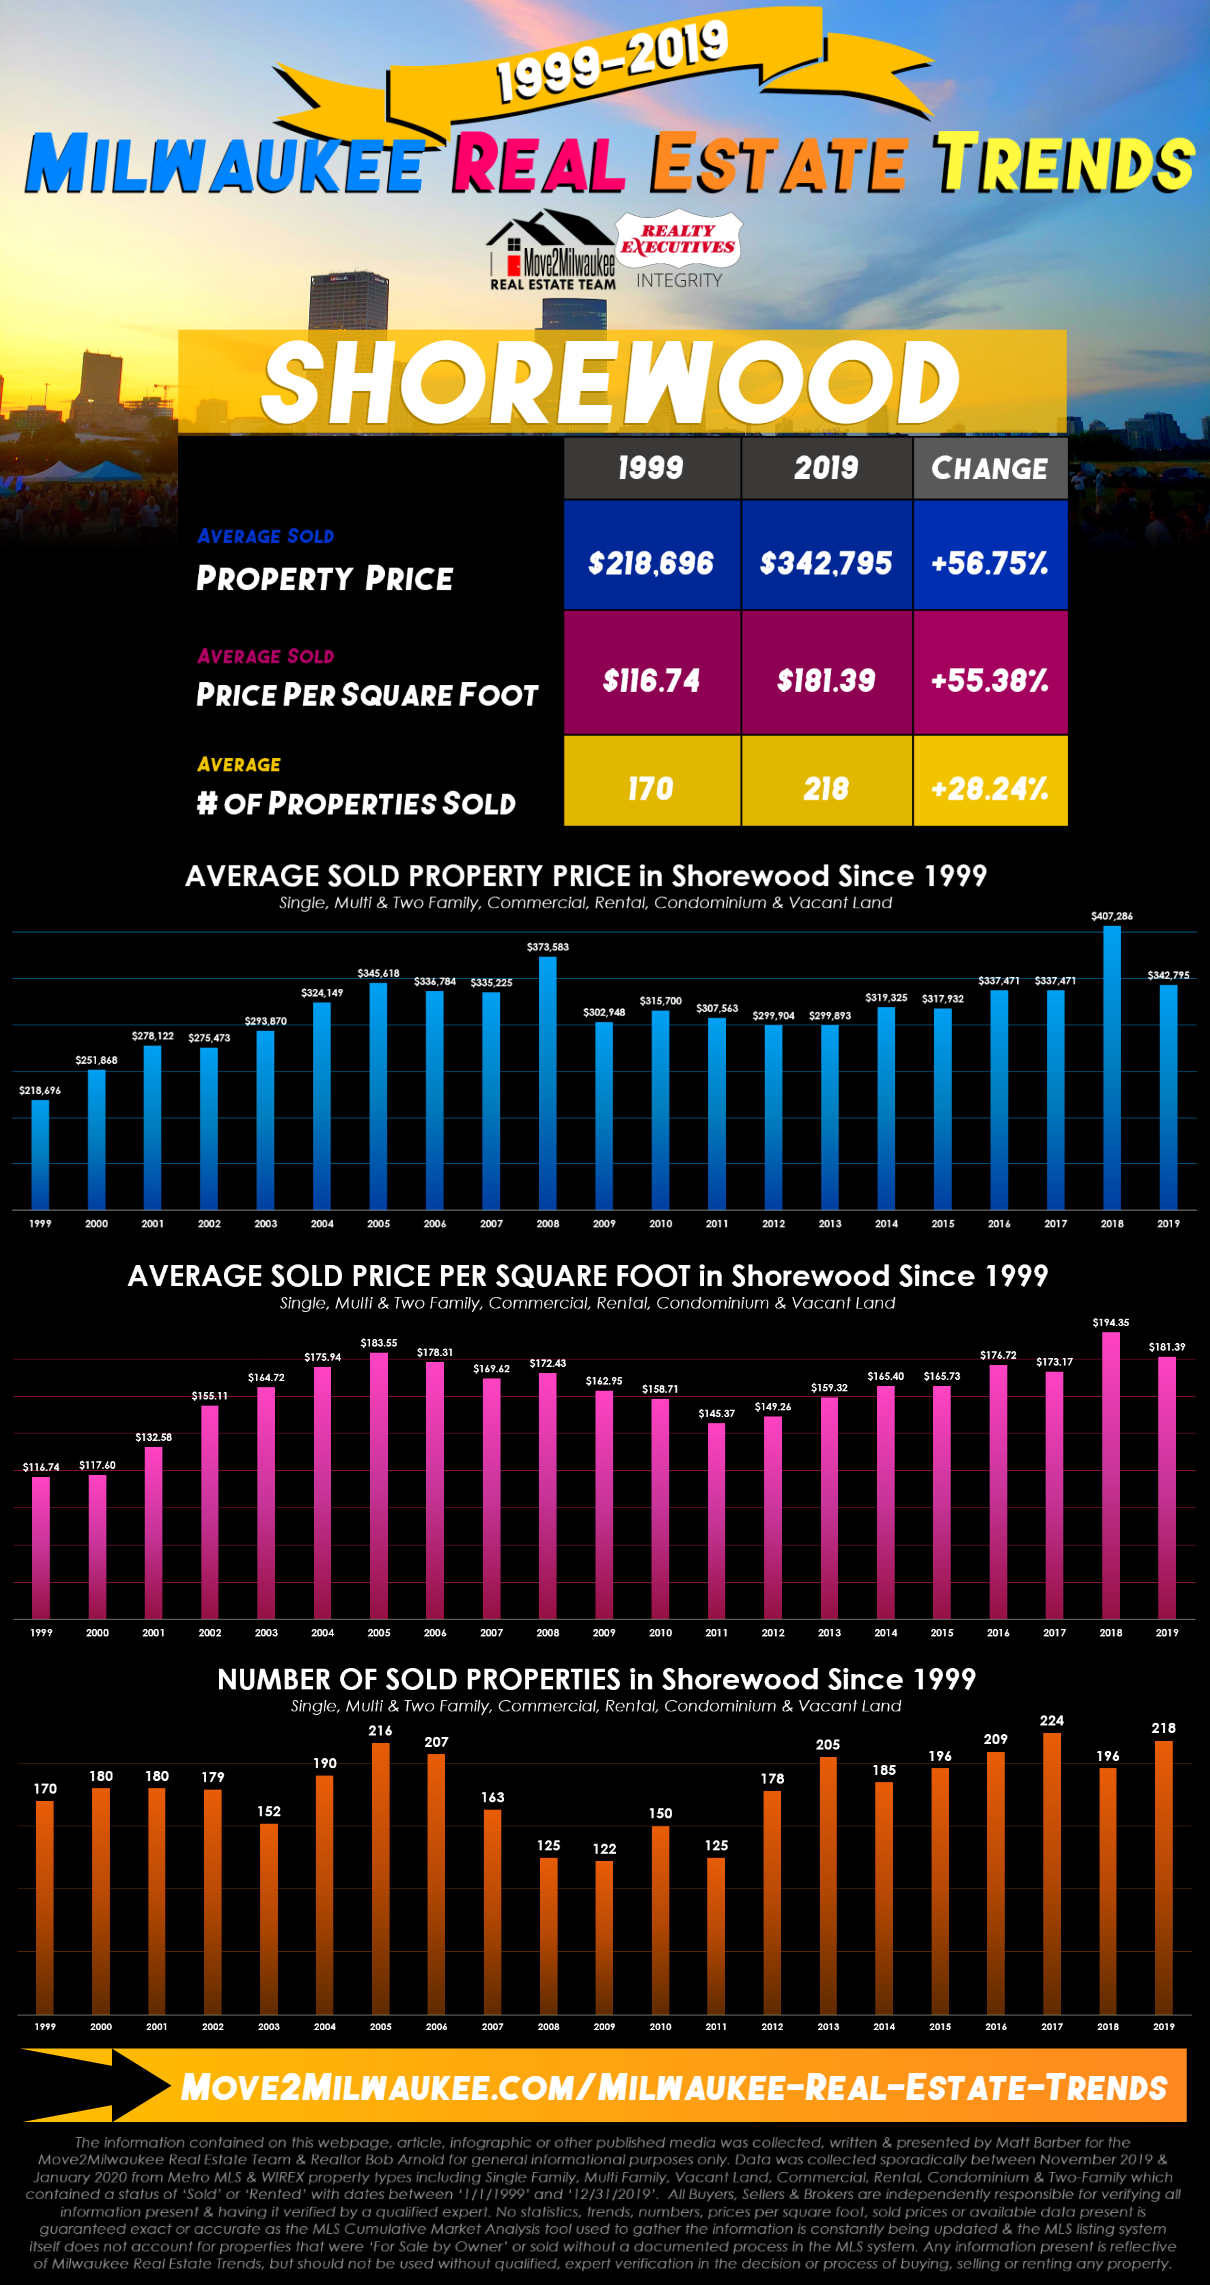
With the average home having an estimated 1,941 of livable square feet, Shorewood, Wisconsin usually falls near the averages of changes seen in Milwaukee County in respects to sold home prices, prices per square foot & number of homes sold in different municipalities. This isn’t bad news at all, in fact, Shorewood has been a very popular neighborhood when it comes to investors because of it’s location.
Not only do homeowners fall in love with Shorewood because of it’s beautiful, historic homes near the Lake, but investors keep their eyes on Shorewood as well because of it’s close proximity to the University of Wisconsin-Milwaukee. Located on the other side of the street of the main campus, Shorewood is a great option for anyone who loves to live or invest near a ‘College Town’.
Population | 13,162
Zip Codes | 53211
Main Attraction | Shorewood Nature Preserve
Median Household Income | $68,306
Average Home Square Footage (1999-2019) | 1,941 Est. Sq. Ft.
Borders Lake Michigan | YES
1999 to 2019 | Shorewood Real Estate Statistics
Sold Single Family, Multi Family, Two Family, Vacant Land, Rental & Condominium Listings
| Shorewood Statistics | # of Sold Properties | Average Sold Property Price | Average Sold Price Per Square Foot |
|---|---|---|---|
| 2019 | 218 | $342,795 | $181.39 |
| 2018 | 196 | $407,286 | $194.35 |
| 2017 | 224 | $337,471 | $173.17 |
| 2016 | 209 | $340,795 | $176.72 |
| 2015 | 196 | $317,932 | $165.73 |
| 2014 | 185 | $319,325 | $165.40 |
| 2013 | 205 | $299,893 | $159.32 |
| 2012 | 178 | $299,904 | $149.26 |
| 2011 | 125 | $307,563 | $145.37 |
| 2010 | 150 | $315,700 | $158.71 |
| 2009 | 122 | $302,948 | $162.95 |
| 2008 | 125 | $373,583 | $172.43 |
| 2007 | 163 | $335,225 | $169.62 |
| 2006 | 207 | $336,784 | $178.31 |
| 2005 | 216 | $345,618 | $183.55 |
| 2004 | 190 | $324,149 | $175.94 |
| 2003 | 152 | $293,870 | $164.72 |
| 2002 | 179 | $275,473 | $155.11 |
| 2001 | 180 | $278,122 | $132.58 |
| 2000 | 180 | $251,868 | $117.60 |
| 1999 | 170 | $218,696 | $116.74 |
SHOREWOOD REAL ESTATE
South Milwaukee Real Estate Statistics
Take a Deeper Look into South Milwaukee, Wisconsin’s Real Estate Trends, Statistics & Data with the Move2Milwaukee Team of Milwaukee Realtors!
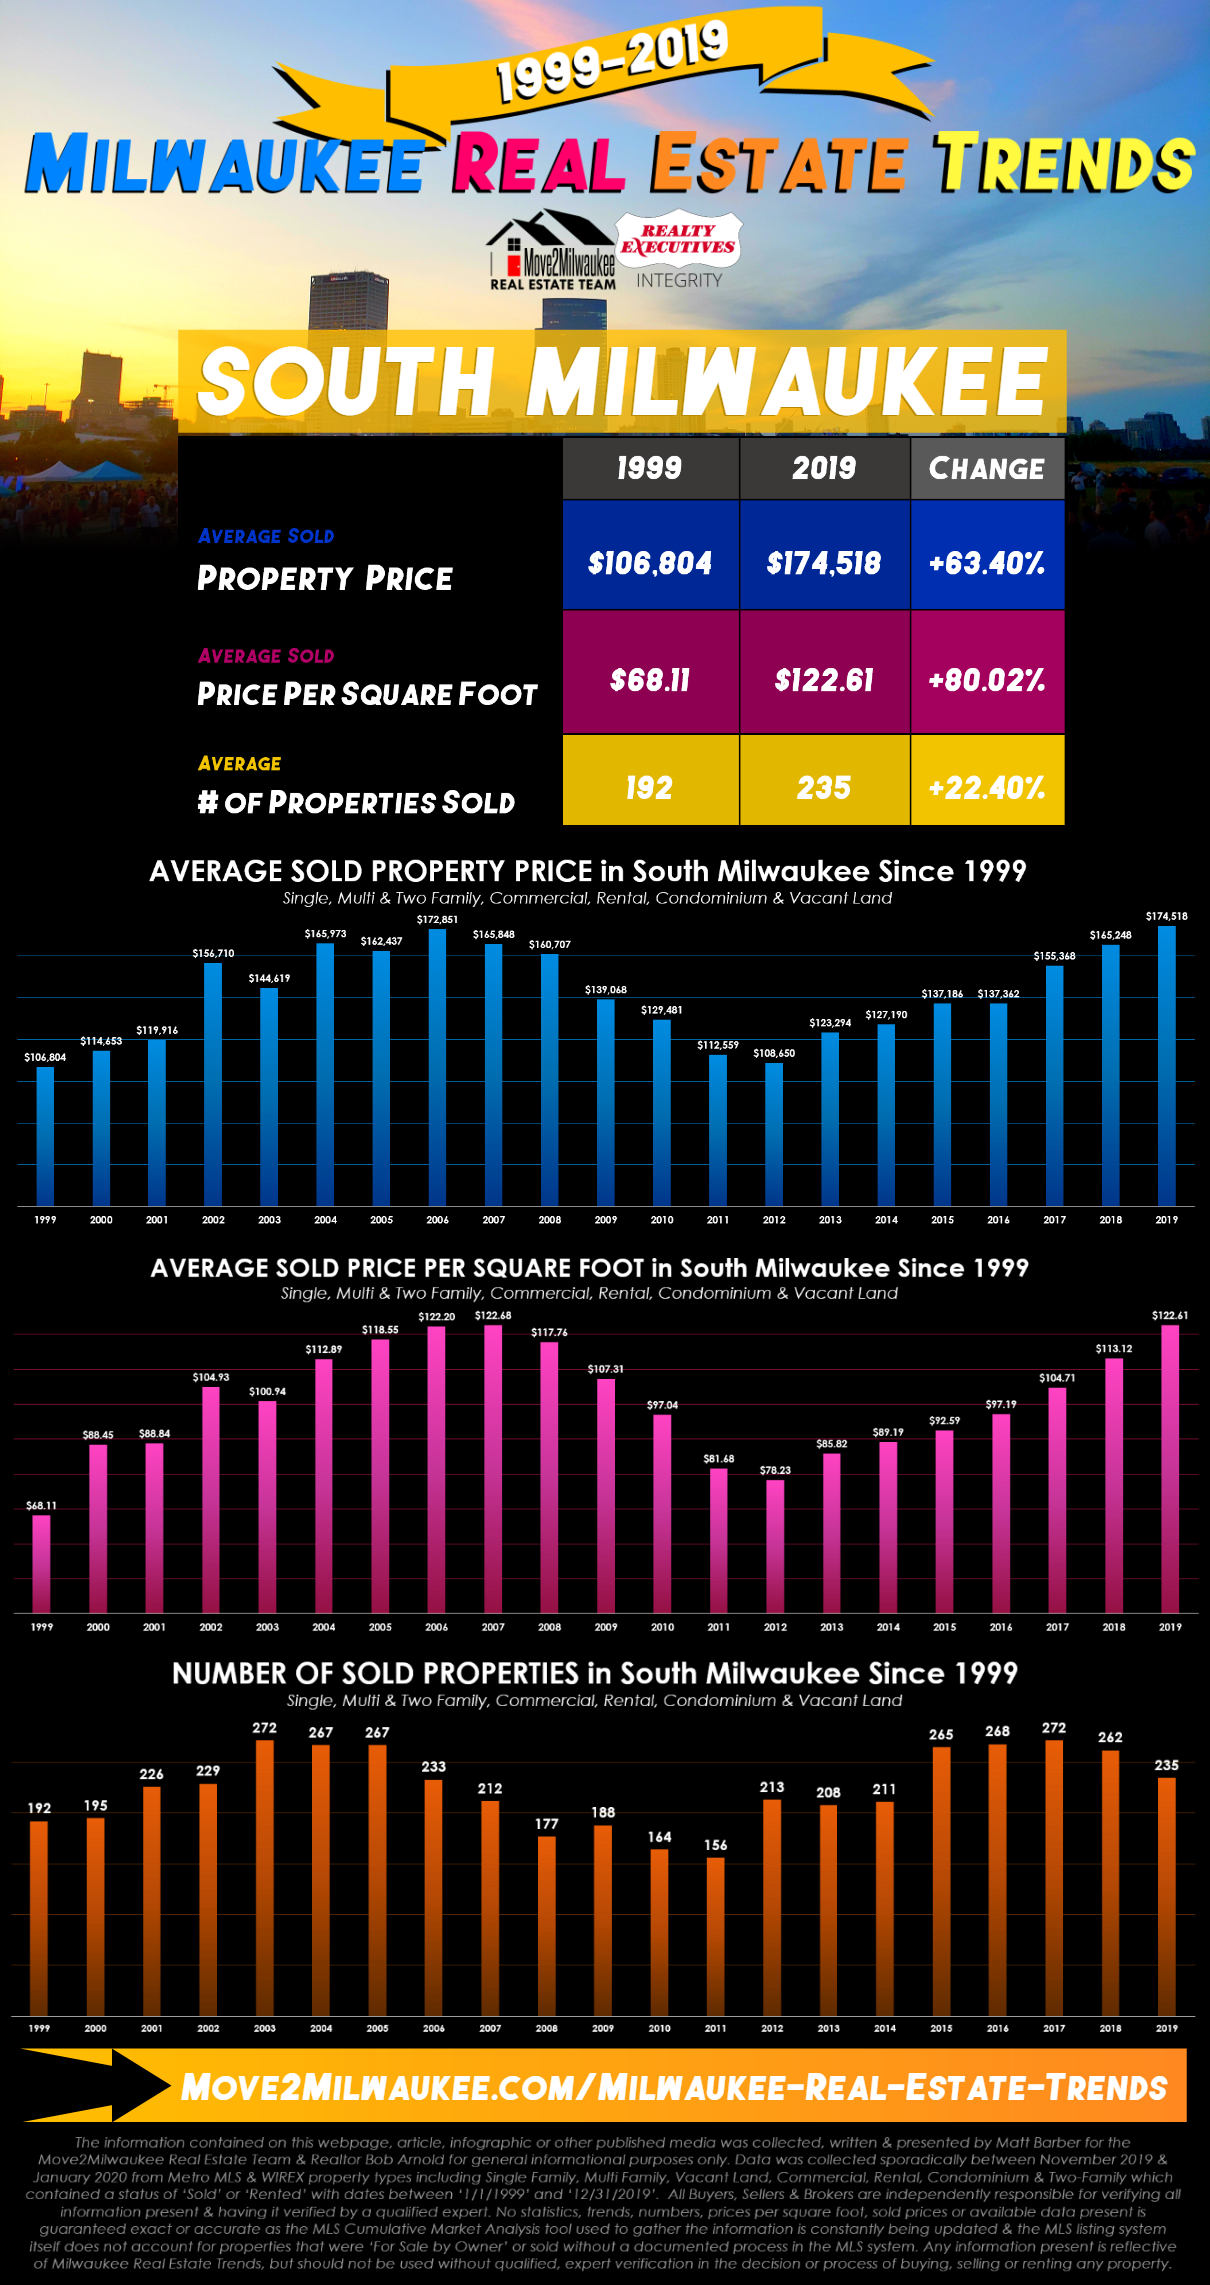
With the average home having an estimated 1,472 of livable square feet, South Milwaukee, Wisconsin had some surprising statistics when we looked at 1999 & 2019. The average sold price per square foot of a home in South Milwaukee in 1999 was $68.11/sq. ft. while in 2019 it was $122.61/sq. ft. That’s a recorded 80.02% increase, #2 overall in Milwaukee County only behind the Bay View neighborhood.
This ranking only surprised us because South Milwaukee does not get the same attention Bay View does. While it may not seemingly be as trendy, the neighborhoods south of Bay View (St. Francis, Cudahy & South Milwaukee) all have an abundance of amenities to offer their homeowners. From Lake Michigan access, affordable suburban neighborhood living, the Oak Leaf biking & hiking trail to public parks galore, South Milwaukee & other south side municipalities are likely to see another jump in value these next 2 decades.
Population | 21,156
Zip Codes | 53172
Main Attraction | Seven Bridges at Grant Park
Median Household Income | $51,484
Average Home Square Footage (1999-2019) | 1,472 Est. Sq. Ft.
Borders Lake Michigan | YES
1999 to 2019 | South Milwaukee Real Estate Statistics
Sold Single Family, Multi Family, Two Family, Vacant Land, Rental & Condominium Listings
| South Milwaukee Statistics | # of Sold Properties | Average Sold Property Price | Average Sold Price Per Square Foot |
|---|---|---|---|
| 2019 | 235 | $174,518 | $122.61 |
| 2018 | 262 | $165,248 | $113.12 |
| 2017 | 272 | $155,368 | $104.71 |
| 2016 | 268 | $137,362 | $97.19 |
| 2015 | 265 | $137,186 | $92.59 |
| 2014 | 211 | $127,190 | $89.19 |
| 2013 | 208 | $123,294 | $85.82 |
| 2012 | 213 | $108,650 | $78.23 |
| 2011 | 156 | $112,559 | $81.68 |
| 2010 | 164 | $129,481 | $97.04 |
| 2009 | 188 | $139,068 | $107.31 |
| 2008 | 177 | $160,707 | $117.76 |
| 2007 | 212 | $165,848 | $122.68 |
| 2006 | 233 | $172,851 | $122.20 |
| 2005 | 267 | $162,437 | $118.55 |
| 2004 | 267 | $165,973 | $112.89 |
| 2003 | 275 | $144,619 | $100.94 |
| 2002 | 229 | $156,710 | $104.93 |
| 2001 | 226 | $119,916 | $88.84 |
| 2000 | 195 | $114,653 | $88.45 |
| 1999 | 192 | $106,804 | $68.11 |
SOUTH MILWAUKEE REAL ESTATE
St. Francis Real Estate Statistics
There’s 20 Years of St. Francis, Wisconsin Real Estate Trends, Statistics & Data to Look Over: What’s Your Verdict?
With the average home having an estimated 1,314 of livable square feet, St. Francis, Wisconsin has the smallest properties listed for sale in Milwaukee County the past 2 decades, but when comparing 1999 & 2019, St. Francis has also had the highest increase in number of sold properties: 108.70%
St. Francis, Wisconsin also took 3rd place in Milwaukee County when it came to a change in average sold property price from 1999 to 2019 with a 95.68% increase. Like South Milwaukee & Cudahy, it offers it’s homeowners Lake Michigan access & plenty of parks to visit. It’s also just south of the Bay View neighborhood, one of the trendiest if not the most trendy areas of Milwaukee.
Population | 9,363
Zip Codes | 53235
Main Attraction | Bay View Park
Median Household Income | $40,116
Average Home Square Footage (1999-2019) | 1,314 Est. Sq. Ft.
Borders Lake Michigan | YES

1999 to 2019 | St. Francis Real Estate Statistics
Sold Single Family, Multi Family, Two Family, Vacant Land, Rental & Condominium Listings
| St. Francis Statistics | # of Sold Properties | Average Sold Property Price | Average Sold Price Per Square Foot |
|---|---|---|---|
| 2019 | 144 | $187,426 | $145.04 |
| 2018 | 179 | $159,348 | $131.04 |
| 2017 | 181 | $147,920 | $117.20 |
| 2016 | 160 | $148,091 | $117.44 |
| 2015 | 135 | $151,312 | $111.41 |
| 2014 | 118 | $140,981 | $103.74 |
| 2013 | 130 | $125,616 | $106.01 |
| 2012 | 89 | $114,444 | $89.98 |
| 2011 | 74 | $134,218 | $112.36 |
| 2010 | 75 | $152,219 | $125.81 |
| 2009 | 92 | $159,712 | $128.61 |
| 2008 | 99 | $151,718 | $128.31 |
| 2007 | 115 | $193,886 | $142.10 |
| 2006 | 116 | $176,937 | $150.71 |
| 2005 | 147 | $178,399 | $152.93 |
| 2004 | 95 | $145,790 | $122.31 |
| 2003 | 91 | $126,745 | $99.75 |
| 2002 | 82 | $112,433 | $94.29 |
| 2001 | 77 | $107,511 | $85.87 |
| 2000 | 69 | $98,620 | $83.64 |
| 1999 | 69 | $95,782 | $82.98 |
ST. FRANCIS REAL ESTATE
Wauwatosa Real Estate Statistics
What do 2 Decades of Local Real Estate Trends & Statistics Reveal about Wauwatosa, Wisconsin?
With the average home having an estimated 1,669 of livable square feet, Wauwatosa, Wisconsin ranks 4th in Milwaukee County for having the highest increase in average property sold price & average property sold price per square foot when comparing 1999 & 2019. This inland municipality is similar to Bay View & Oak Creek in that it has had recent developments bring value to the area while also offering affordable living for it’s residents.
Homeowners in Wauwatosa may not be on the lake, but plenty of restaurants & shopping centers nearby, it’s a great place to live if you’re looking for convenience. Home to the Milwaukee Regional Medical Center, it’s also a major healthcare hub. Wauwatosa is also home to Bryant & Stratton College, Mount Mary University & the Medical College of Wisconsin.
Population | 48,376
Zip Codes | 53226
Main Attraction | Mayfair Outlet Mall
Median Household Income | $74,929
Average Home Square Footage (1999-2019) | 1,669 Est. Sq. Ft.
Borders Lake Michigan | NO

1999 to 2019 | Wauwatosa Real Estate Statistics
Sold Single Family, Multi Family, Two Family, Vacant Land, Rental & Condominium Listings
| Wauwatosa Statistics | # of Sold Properties | Average Sold Property Price | Average Sold Price Per Square Foot |
|---|---|---|---|
| 2019 | 829 | $275,151 | $161.11 |
| 2018 | 780 | $263,359 | $152.20 |
| 2017 | 845 | $243,156 | $145.19 |
| 2016 | 822 | $227,791 | $139.54 |
| 2015 | 816 | $221,135 | $134.27 |
| 2014 | 711 | $213,381 | $131.17 |
| 2013 | 705 | $213,071 | $129.94 |
| 2012 | 548 | $193,090 | $114.50 |
| 2011 | 479 | $195,173 | $112.52 |
| 2010 | 476 | $211,397 | $159.97 |
| 2009 | 525 | $206,126 | $127.00 |
| 2008 | 527 | $224,887 | $138.47 |
| 2007 | 668 | $235,196 | $145.98 |
| 2006 | 665 | $233,073 | $149.38 |
| 2005 | 679 | $235,978 | $143.69 |
| 2004 | 663 | $216,140 | $135.07 |
| 2003 | 687 | $193,825 | $123.43 |
| 2002 | 646 | $178,228 | $113.03 |
| 2001 | 615 | $165,525 | $103.92 |
| 2000 | 601 | $152,424 | $95.25 |
| 1999 | 709 | $140,859 | $91.59 |
WAUWATOSA REAL ESTATE
West Allis Real Estate Statistics
Take an In-Depth Analysis of West Allis, Wisconsin Real Estate Trends, Data & Statistics!
With the average home having an estimated 1,322 of livable square feet, West Allis, Wisconsin offers some of the smaller homes listed for sale in Milwaukee County & is one of the most consistent municipalities in the local real estate market as well. While we still do see increases in pricing exceeding 50%, West Allis usually falls below the average increases seen in the area.
West Allis is popular for residents because of it’s more affordably priced homes & proximity to local shopping centers & the famous Wisconsin State Fair Park. Many grocery stores can be found in West Allis along with the West Allis Towne Shopping Center & Greenfield Park.
Population | 60,411
Zip Codes | 53214, 53219, 53227
Main Attraction | Wisconsin State Fair Park
Median Household Income | $47,669
Average Home Square Footage (1999-2019) | 1,322 Est. Sq. Ft.
Borders Lake Michigan | NO

1999 to 2019 | West Allis Real Estate Statistics
Sold Single Family, Multi Family, Two Family, Vacant Land, Rental & Condominium Listings
| West Allis Statistics | # of Sold Properties | Average Sold Property Price | Average Sold Price Per Square Foot |
|---|---|---|---|
| 2019 | 994 | $156,789 | $121.91 |
| 2018 | 1,013 | $146,112 | $108.71 |
| 2017 | 1,009 | $135,414 | $102.28 |
| 2016 | 1,004 | $126,836 | $94.16 |
| 2015 | 870 | $117,447 | $92.09 |
| 2014 | 688 | $112,609 | $84.60 |
| 2013 | 743 | $108,314 | $84.15 |
| 2012 | 674 | $98,094 | $74.12 |
| 2011 | 533 | $103,782 | $80.80 |
| 2010 | 569 | $128,091 | $97.71 |
| 2009 | 658 | $132,825 | $105.18 |
| 2008 | 618 | $146,757 | $114.61 |
| 2007 | 728 | $162,410 | $127.18 |
| 2006 | 842 | $160,930 | $130.13 |
| 2005 | 955 | $162,517 | $129.30 |
| 2004 | 911 | $147,115 | $115.49 |
| 2003 | 857 | $133,209 | $107.65 |
| 2002 | 807 | $123,714 | $94.65 |
| 2001 | 888 | $116,403 | $92.42 |
| 2000 | 771 | $105,708 | $86.03 |
| 1999 | 773 | $100,794 | $82.20 |
WEST ALLIS REAL ESTATE
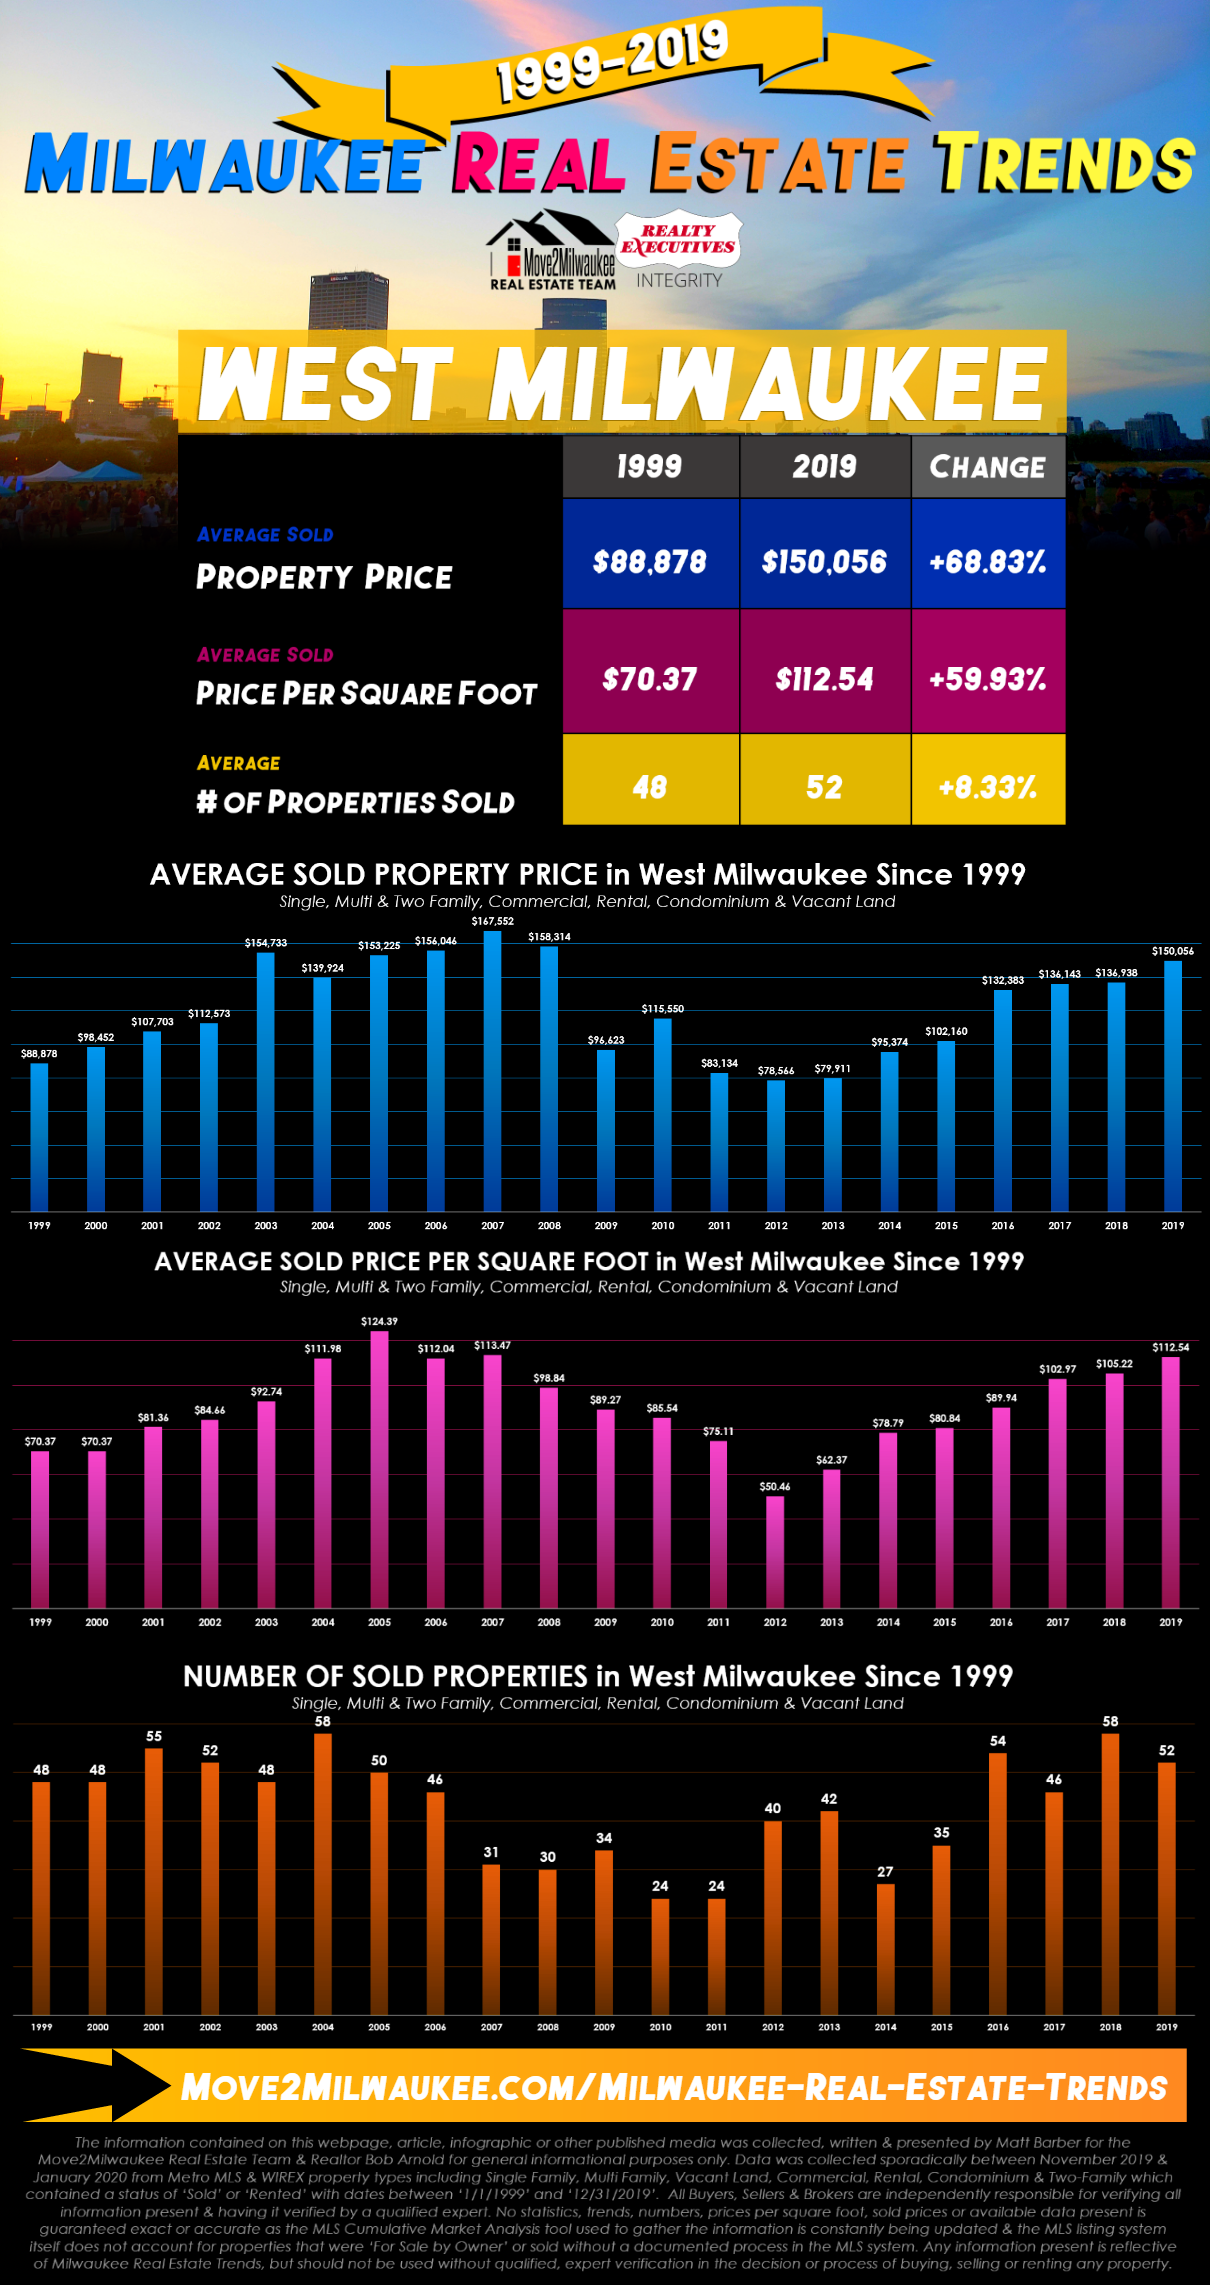
West Milwaukee Real Estate Statistics
Take an Inside Look at West Milwaukee, Wisconsin’s Real Estate Trends & Statistics from the Last 2 Decades!
With the average home having an estimated 1,350 of livable square feet, West Milwaukee, Wisconsin may not have the largest homes listed for sale between 1999 & 2019, but when comparing both years, it does rank 8th out of 20 of Milwaukee County’s municipalities for it’s 59.94% increase in average sold price per square foot. ($70.37/sq. ft. in 1999 vs $112.54/sq. ft. in 2019)
It’s not surprising to see this rise in value as West Milwaukee is just west of the recently developed & trendy Third Ward, Fifth Ward & Bay View. Residents living in West Milwaukee have convenient access to grocery stores & shopping centers. Paired with a shorter drive to the Lakefront than Wauwatosa or West Allis, it’s clear to see why West Milwaukee is gaining traction.
Population | 4,206
Zip Codes | 53214, 53219, 53215
Median Household Income | $35,286
Average Home Square Footage (1999-2019) | 1,350 Est. Sq. Ft.
Borders Lake Michigan | NO
1999 to 2019 | West Milwaukee Real Estate Statistics
Sold Single Family, Multi Family, Two Family, Vacant Land, Rental & Condominium Listings
| West Milwaukee Statistics | # of Sold Properties | Average Sold Property Price | Average Sold Price Per Square Foot |
|---|---|---|---|
| 2019 | 52 | $150,056 | $112.54 |
| 2018 | 58 | $136,938 | $105.22 |
| 2017 | 46 | $136,143 | $102.97 |
| 2016 | 54 | $132,383 | $89.94 |
| 2015 | 35 | $102,160 | $80.84 |
| 2014 | 27 | $95,374 | $78.79 |
| 2013 | 42 | $79,911 | $62.37 |
| 2012 | 40 | $78,566 | $50.46 |
| 2011 | 24 | $83,134 | $75.11 |
| 2010 | 24 | $115,550 | $85.54 |
| 2009 | 34 | $96,623 | $89.27 |
| 2008 | 30 | $158,314 | $98.84 |
| 2007 | 31 | $167,552 | $113.47 |
| 2006 | 46 | $156,046 | $112.04 |
| 2005 | 50 | $153,225 | $124.39 |
| 2004 | 58 | $139,924 | $111.98 |
| 2003 | 48 | $154,733 | $92.74 |
| 2002 | 52 | $112,573 | $84.66 |
| 2001 | 55 | $107,703 | $81.36 |
| 2000 | 48 | $98,452 | $70.37 |
| 1999 | 48 | $88,878 | $70.37 |
WEST MILWAUKEE REAL ESTATE
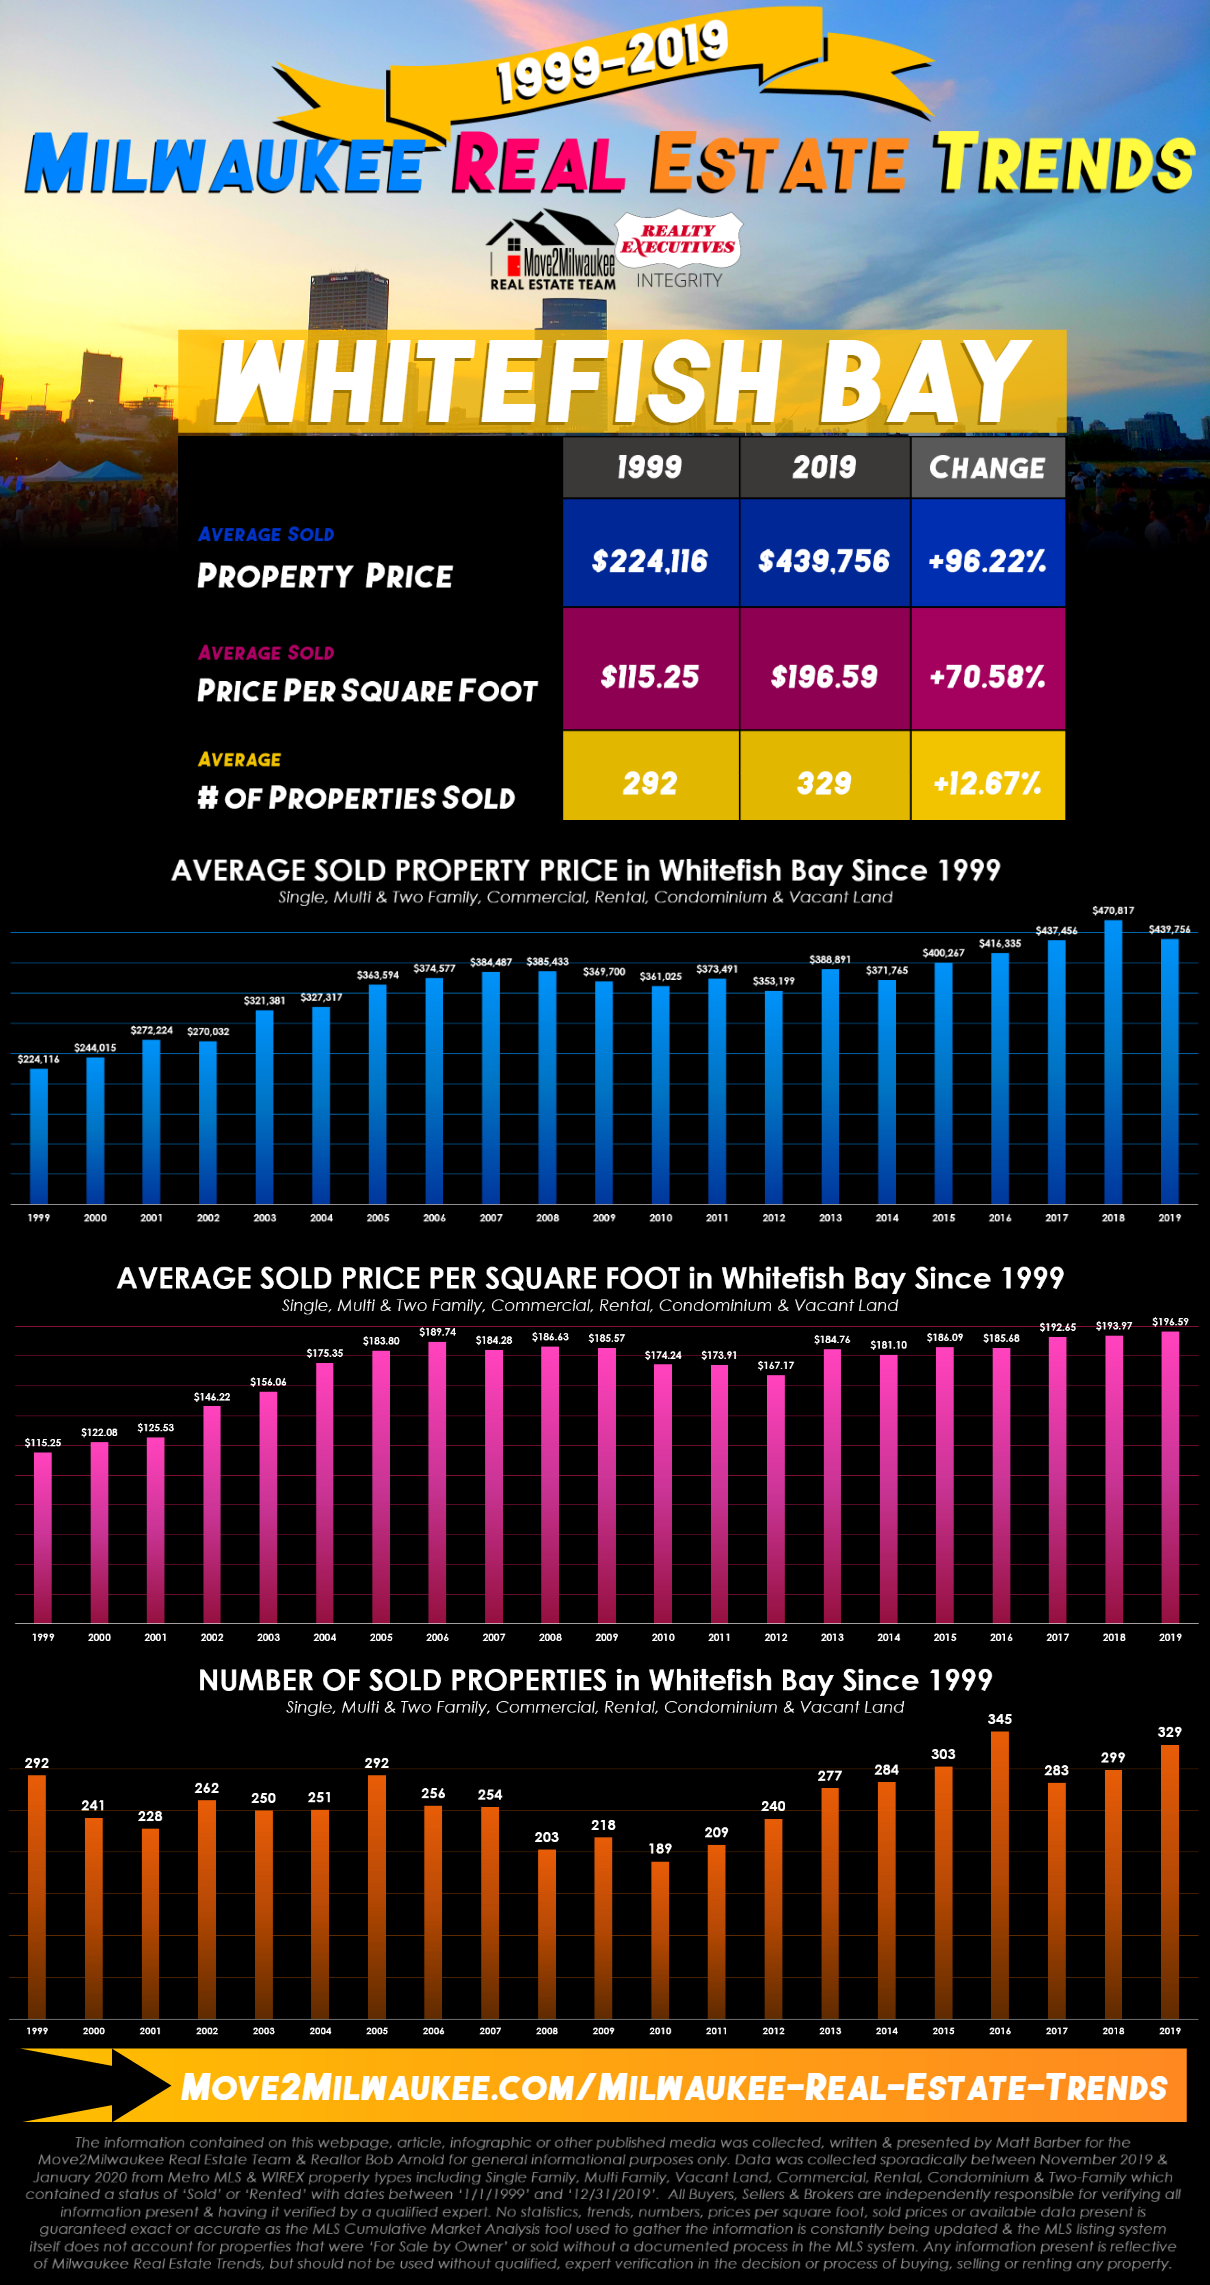
Whitefish Bay Real Estate Statistics
Take a Peek into the Last 2 Decades of Whitefish Bay, WI Real Estate Trends, Data & Statistics with Move2Milwaukee!
With the average home having an estimated 2,069 of livable square feet, Whitefish Bay, Wisconsin has seen the 2nd highest increase in average sold property price when comparing 1999 ($224,116) to 2019 ($439,756). That’s a 96.22% increase in average sold property prices!
Whitefish Bay is probably best known for it’s stately homes & quiet living. It’s located just north of Milwaukee so professionals flock to this neighborhood because of it’s location & amenities. The statistics point out two very important qualities of this municipality: 1. Value has been on the rise & 2. Homeowners are not selling any dramatically faster than they were 2 decades ago.
Population | 14,110
Zip Codes | 53211, 53217
Main Attraction | Big Bay Park
Median Household Income | $111,069
Average Home Square Footage (1999-2019) | 2,069 Est. Sq. Ft.
Borders Lake Michigan | YES
1999 to 2019 | Whitefish Bay Real Estate Statistics
Sold Single Family, Multi Family, Two Family, Vacant Land, Rental & Condominium Listings
| Whitefish Bay Statistics | # of Sold Properties | Average Sold Property Price | Average Sold Price Per Square Foot |
|---|---|---|---|
| 2019 | 329 | $439,756 | $196.59 |
| 2018 | 299 | $470,817 | $193.97 |
| 2017 | 283 | $437,456 | $192.65 |
| 2016 | 345 | $416,335 | $185.68 |
| 2015 | 303 | $400,267 | $186.09 |
| 2014 | 284 | $371,765 | $181.10 |
| 2013 | 277 | $388,891 | $184.76 |
| 2012 | 240 | $353,199 | $167.17 |
| 2011 | 209 | $373,491 | $173.91 |
| 2010 | 189 | $361,025 | $174.24 |
| 2009 | 218 | $369,700 | $185.57 |
| 2008 | 203 | $385,433 | $186.63 |
| 2007 | 254 | $384,487 | $184.28 |
| 2006 | 256 | $374,577 | $189.74 |
| 2005 | 292 | $363,594 | $183.80 |
| 2004 | 251 | $327,317 | $175.35 |
| 2003 | 250 | $321,381 | $156.06 |
| 2002 | 262 | $270,032 | $146.22 |
| 2001 | 228 | $272,224 | $125.53 |
| 2000 | 241 | $244,015 | $122.08 |
| 1999 | 292 | $224,116 | $115.25 |
WHITEFISH BAY REAL ESTATE
*The information contained on this webpage, article, infographic or other published media was collected, written & presented by Matt Barber for the Move2Milwaukee Real Estate Team & Realtor Bob Arnold for general information purposes ONLY. Data was collected sporadically between November 2019 & January 2020 from Metro MLS & WIREX property types including Single Family, Multi Family, Vacant Land, Commercial, Rental, Condominium & Two-Family which contained a status of ‘Sold’ or ‘Rented’ with dates between ‘1/1/1999′ (January 1st, 1999) and ’12/31/2019’ (December 31st, 2019). All Buyers, Sellers & Brokers are independently responsible for verifying all information present & having it verified by a qualified expert. No statistics, trends, numbers, prices per square foot, sold prices or available data present is guaranteed exact or accurate as the MLS Cumulative market Analysis tool used to gather the information is constantly being updated & the MLS listing system itself does not account for properties that were ‘For Sale by Owner’ or sold without a document process in the MLS system. Any information present is reflective of Milwaukee Real Estate Trends, but should not be used without qualified, expert verification in the decision or process of buying, selling or renting any property.